Unlock Energy Consumption in the Cloud with eBPF
An article focused on the measurement and management of energy consumption in cloud computing and shows step by step how energy consumption in the cloud can be better recorded down the road.
For the last two years, I’ve started to look into sustainability and what it means for software engineering, with a focus on the cloud native field. I explored this during studying for my master's in computer science and in the open source CNCF community (CNCF TAG ENV). To me, sustainability + software is about understanding how the virtual world we are creating with software may look when balanced with the world we live in. The environmental aspect of sustainability in the technical domain, which is about the consumption of resources to build virtual services and how this all fits together, is very intriguing to me to explore further. There is a lot that yet needs to be explored in this field, I would like to share in this blog post series a couple of thoughts on how I look at this developing field. There are different ways you can understand complex relationships in areas such as this, you can focus on different aspects, highlight other areas. The perspective that I share throughout the next three blogs are mostly around navigating abstraction layers.
So why is this blog post called “Unlock Energy Consumption in the Cloud with eBPF”? The title foreshadows where the journey leads to. The title uses the term “unlock” to indicate that we do not yet have proper measurement in the cloud to collect energy consumption, and it mentions eBPF as a solution; however, it should more be taken as an option into account. Based on eBPF several new tools emerged that allow for more detailed and fine-grained collection of metrics and with that decision-making. But we will explore that later. Honestly, this series touches on a lot of stuff, so it can be called anything, really.
In Paris March 2024 at Kubecon I will give a talk about some version of these blogs as a talk. I mainly wrote these blogs as preparation for the talk. But now, a lot more work went into the blogs before even starting working on the talk (directly). You can find a link to the talk here.
The Imperative of Measuring Energy Consumption in the Cloud: When and Why to Begin
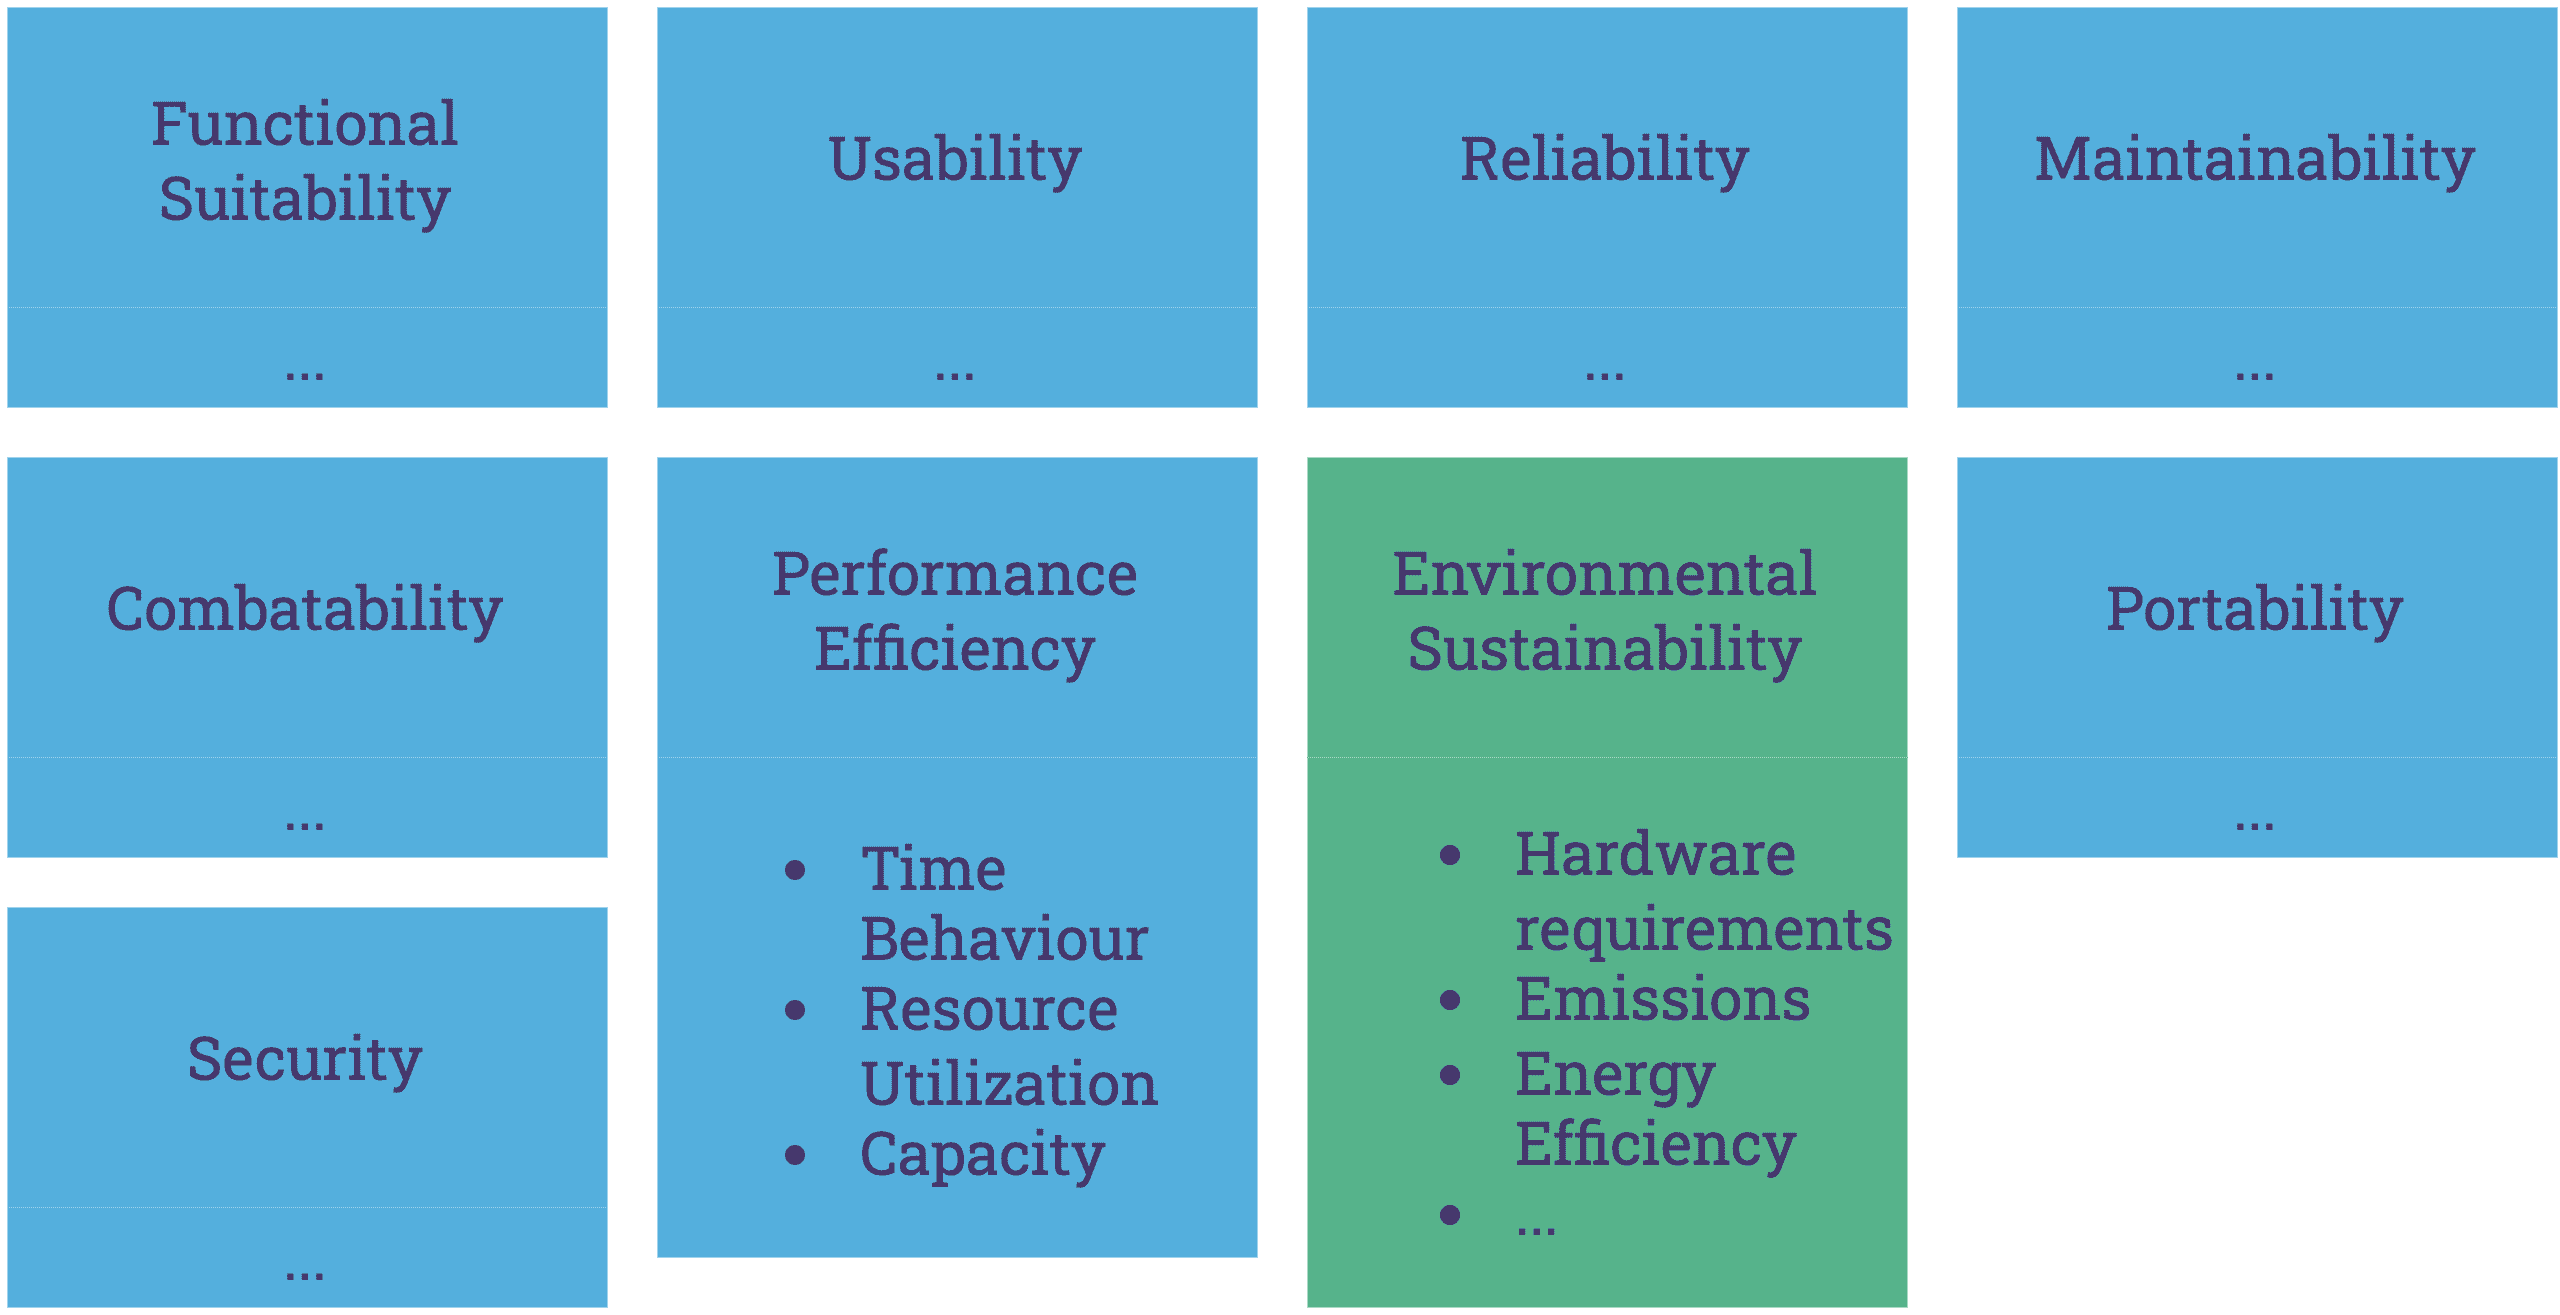
In our pursuit of building good software, we must be aware of many quality factors that make software engineering challenging (and fun). These factors include whether the software is maintainable after development, whether it is extendable and can adapt to changing requirements, whether it is portable and can be deployed to different infrastructures, and whether it is secure and reliable. There are numerous other nuances to consider, and you can deep dive into each of them for even more depth. As software engineers, we strive to navigate these requirements towards achieving building good software. Although energy efficiency (among other metrics around resource consumption) is for the most part not commonly recognized as a quality requirement, it should become one for a simple reason. Software significantly influences how our societies are built, and this influence is only set to increase as the role of software across industries and societies continues to expand. So you can say that with sustainable software engineering, we try to balance the virtual world we build with the real world we have. As we become more reliant on software, we need to start valuing natural resources and engineer not just towards performance, user experience and security but also for environmental sustainability and with that for energy efficiency.
In the hardware sector, we observe generation-to-generation efficiency improvements that also reduce overall energy consumption. By transitioning to increasingly smaller nanometer chip architectures, we can achieve more computing power with the same amount of energy (usually). However, we are approaching a physical limit, and it is evident that Moore's Law is beginning to plateau. Simultaneously, software is not becoming more resource-efficient; instead, it is becoming, for the most part, more bloated. This issue was recognized by software engineers over 30 years ago. An interesting article published in 1995 highlighted this concern:
About 25 years ago, a [...] text editor could be developed with only 8,000 bytes of memory. (Modern program editors require 100 times as much!) [...] Has all this bloated software become faster? Quite the opposite. If the hardware wasn't a thousand times faster, modern software would be completely useless [source].
In the article they mentioned among the reasons behind this trend is inflationary feature management, time pressure, and the complexity of tasks. You may think that this article is quite old in the fast-moving software space, however, I think the observation is still true today. Not in every aspect for sure, if the hardware offers more resources to be used, naturally software will be developed to make the best out of it. This is not the criticism, the criticism is about pointing out a trend where software grows without good reason. It's a matter of setting requirements for resources. If we do not measure energy consumption and the use of natural resources, software will remain misaligned with environmental sustainability goals. Without knowledge: data: metrics; we will not detect flaws in current tools and practices. To recognize new requirements, we first need to build a solid understanding and then have a tangible indicator that we can develop against. We are engineers, after all, right.
Examples – Exposing Bad Energy Efficiency
Not looking into energy as a metric, developing software leads to the emergence of technologies that exert a considerable negative impact on resource usage and energy consumption. To me, energy and resource consumption of software is an afterthought, if done well, a nice aspect of software design to highlight on the website for marketing.
Recent examples showcasing high-energy demands are around LLMs (large language models) [source], cryptocurrencies, and blockchain technologies [source]. But, this issue does also extend on a smaller scale to everyday applications that are bloated with features. Innovative technologies should include energy efficiency and care about resources used to be actually useful for a wide audience. Software has a maturity curve, and it is expected that technologies will be less efficient in the first year of release than they will be years later. However, this does not justify releasing software or offering services to a broad audience that in turn consumes a gigantic number of resources. It is not that simple.
[SIDE NOTE] Researchers estimated that creating GPT-3, which has 175 billion parameters, consumed 1,287 megawatt hours of electricity and generated 552 tons of carbon dioxide equivalent, the equivalent of 123 gasoline-powered passenger vehicles driven for one year. And that’s just for getting the model ready to launch, before any consumers start using it [source].
AI, ML, LLMs as well as tech around blockchain seems to me like a public experiment, which should lead to better access to knowledge (AI things) or better autonomy and privacy (blockchain). Comparing the immediate as well as potential benefits against the negatives (environment concerns et al.) is not clear to tell right away. There is a short paper about the upsides and downsides of LLMs [source]. I will leave this as an unfinished discussion open and move on!
In an older study from 2014 looked into energy usage of various day to day software like, Google Docs. There is a nice visualization about the energy footprint which shows a big difference between Google Docs and a similar program, LibreOffice. A detailed analysis of its energy consumption profile of Google Docs indicates that specific functionalities, especially those related to document synchronization with cloud services and spell checking, significantly increase energy consumption due to the increased event rate with each keystroke [source]. Despite Google Docs being a well-engineered and highly useful tool, it exemplifies augmented resource utilization relative to similar products designed earlier. There is a good chance the energy footprint of Google Docs, which is just used as an example here, has improved. But we don't know if we do not measure it.
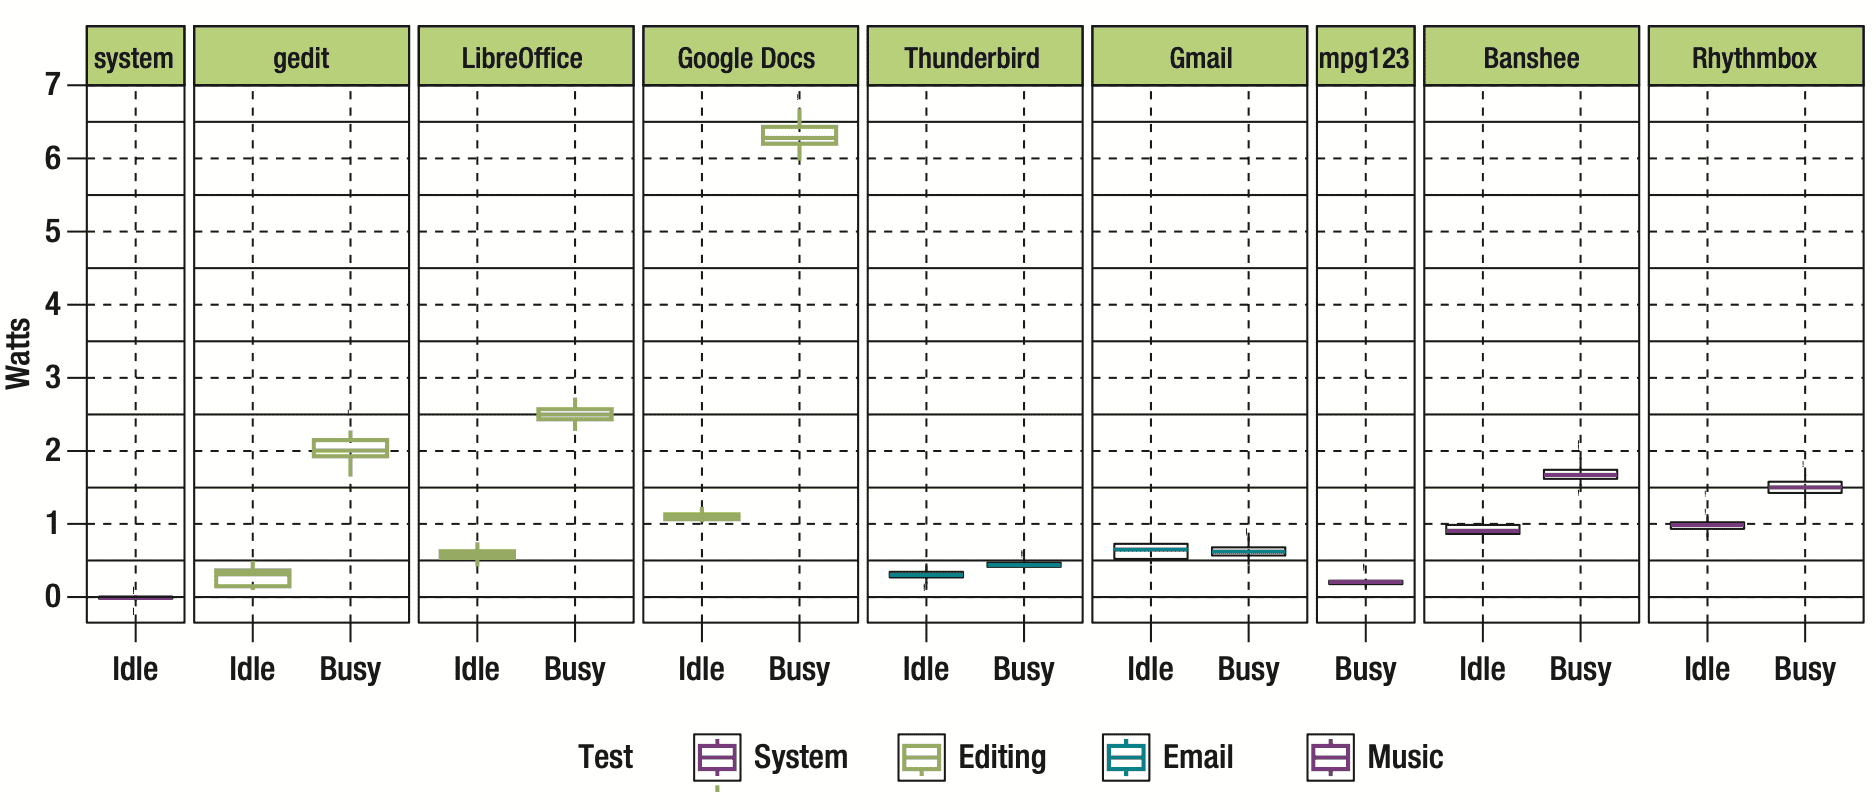
So, the learning is firstly, the importance of actively assessing resource usage, as it often remains unnoticed until scrutinized; and secondly, users of products like Google Docs are unable to decide between products if resources used are invisible to them. Perhaps the cloud synchronization features of Google Docs that lead to increased energy consumption are worth the extra resource consumption for your usecase - maybe - maybe not - the user cannot tell. Following this thought further, there is an absence of options for users to opt-in and out of certain features. The cost of using more resources is lost due to the invisible factor of software.
[SIDE NOTE] The invisibility factor of software is one of the challenges in ethical software engineering [source], and you may argue to place environmental software engineering into this field. The invisibility factor also plays a large role in realizing and overcoming the challenges of energy and the resource footprint of software in the cloud.
Cloud & Energy
In the cloud, we have a shared responsibility for our system due to the nature of distributed systems and service offerings. We run software with the confidence of service-level agreements (SLAs) on other datacenters. The security of your systems in the cloud is not just in your hands, but it also relies on the service infrastructure and hardware infrastructure of the ones managing the cloud offering for you. This is mostly known in the security context, but it is also relevant, when we talk about energy and sustainability, since we require access and knowledge about the infrastructure and APIs to make statements. Cloud providers are taking steps (very tiny, tiny or small ones) to provide their customers transparency of resources used. With open source and cloud native projects, it is becoming easier to maintain your own service offering and be digital sovereignty. If you don't maintain your datacenter, information needed to assess energy consumption and resource consumption is invisible and virtualized away from you.
Cloud providers either need to expose detailed information about their infrastructure and expose metrics about hardware components and energy consumption. But it is unlikely that this will happen soon or at all because cloud providers need to put in a lot of effort to get this information, it has security implications, price negotiation implications, and it also begs the question of how cloud providers should prioritize sustainability vs. advancements in technology. Measuring your resource consumption is therefore more challenging. Users have two options: either move away and start owning their hardware, or you keep your systems where they are and try to approximate as best you can without ever getting real numbers or taking steps to improve technical environmental sustainability. Either way, if you start looking into green software, energy consumption of your software you will likely encounter ways that are based on correlations. Let’s take a look.
Relying on correlations like performance or cost ($) as a key metrics does not suffice
As we will explore in the next article of this series, energy consumption of software is always based on assumptions and close approximations if there are no hardware meters to support it. In that light, using correlations is a good starting point to build a strategy if no hardware support is given. It is important to keep in mind that a correlation will stay a correlation and does not imply causation. If we try to solve this problem just with software, cost ($) and performance look like good metrics we can correlate from. But that is just at its first glance. There are plenty of reasons why these two metrics are not sufficient in the immediate, mid and long-term.
Firstly, cost ($) and performance are metrics that are relevant today and always were, but we have built wasteful software regardless. These metrics have not prevented that from happening.
Cases of performance as indicator for energy consumption:
| Low-Energy Consumption | High-Energy Consumption |
|---|---|
| Poor Energy Performance; Using TCP in scenarios where UDP is better suited, leading to unnecessary overhead and slower data transmission, without necessarily increasing energy consumption. Or a scenario as simple as unnecessary long sleep times between processing packages. | Running an inefficient algorithm that requires excessive computation time and resources, like a poorly optimized regex or database query on large datasets. |
| Good Energy Performance; The Linux Kernel is optimized for performance across a wide range of devices from servers to mobile phones, ensuring efficient use of system resources. It includes energy management features, like CPU frequency scaling (allowing the CPU to run at lower speeds when full power isn't needed), and system sleep states, which significantly reduce energy consumption while maintaining responsiveness and performance. | The process of mining cryptocurrencies like Bitcoin involves solving complex cryptographic puzzles to validate transactions and secure the network. This requires specialized hardware such as ASICs (Application-Specific Integrated Circuits) or GPUs (Graphics Processing Units) that consume a large amount of electricity to perform intensive computational work continuously. |
You can do the same for money cost ($) as an indicator for energy consumption:
| Low-Energy Consumption | High-Energy Consumption |
|---|---|
| Low Energy Cost; Using shared or low-performance cloud instances for non-critical, background tasks. These services cost less and can be energy efficient due to their lower computational energy and shared nature. | Running older, depreciated hardware or opting for cheaper, non-energy-efficient cloud services. The lower cost can be misleading because these options may consume more energy due to less efficient operations or older technology. |
| High Energy Cost; Investing in energy-efficient hardware or cloud services that reduce overall energy usage but come at a higher upfront cost, such as high-efficiency servers or renewable energy sources. | Utilizing large-scale, high-performance computing resources for complex simulations or data analysis. While these resources accelerate computation, their operational expenses and energy consumption are both high. |
By these examples, it’s clear that we cannot have high confidence assessing the energy consumption based on performance or cost ($) as parameters.
We will explore in the next chapter how we can get better metrics right now about the energy consumption of our system. We will do that my moving through the abstraction layers, exploring how these layers are used together and where responsibilities are.
Navigating the Landscape of APIs for Energy Measurement in the Cloud
Measuring the energy consumption of your system is not a trivial endeavor, especially when it comes to the cloud. In the cloud, we usually manage a complex infrastructure with all kinds of heterogeneous services that are managed by different parties, which makes all of this so much more challenging. In this blog, we will not explore the organizational or management challenges that come with this, but rather focus on how this can technically be approached today.
We're all familiar with electric power, but it's something we don't often deal with in software engineering. Energy is consumed by hardware components in order to toggle transistors, the fundamental switches of electronic devices. Simply put, less energy is needed when fewer transistors are turned on, and more energy is needed when more transistors are switched on and off. It is a bit more complicated than this, since it is also about how switches are used and not just about the number of switches available. However, that is outside the scope of this blog.
From year to year, we see smaller chip sizes being released with smaller transistors, moving towards more compact nanometer sizes. This reduction in size implies that a greater number of transistors can be utilized within a given energy budget, theoretically enabling enhancements in performance without corresponding increases in energy consumption. Yet this evolution also brings new challenges, such as managing heat output and the quantum mechanical effects that become significant at such small scales. We won't go into these here.
Software engineering emphasizes on building layers of abstraction. That is also the case with abstracting raw hardware, resulting in no direct access to transistors. This separation is advantageous because it allows software developers to focus on functionality and user experience without having to worry about hardware operations. Because of this, precise energy measurement can only be done with direct hardware support, like using IoT devices that are placed between the computing resources and the energy source. Without hardware support, software-based methods for estimating energy consumption will have to rely on approximations. Given these constraints, how can we effectively measure energy within the complex landscape of cloud computing?
Measuring Energy Consumption — Moving Abstraction Layers
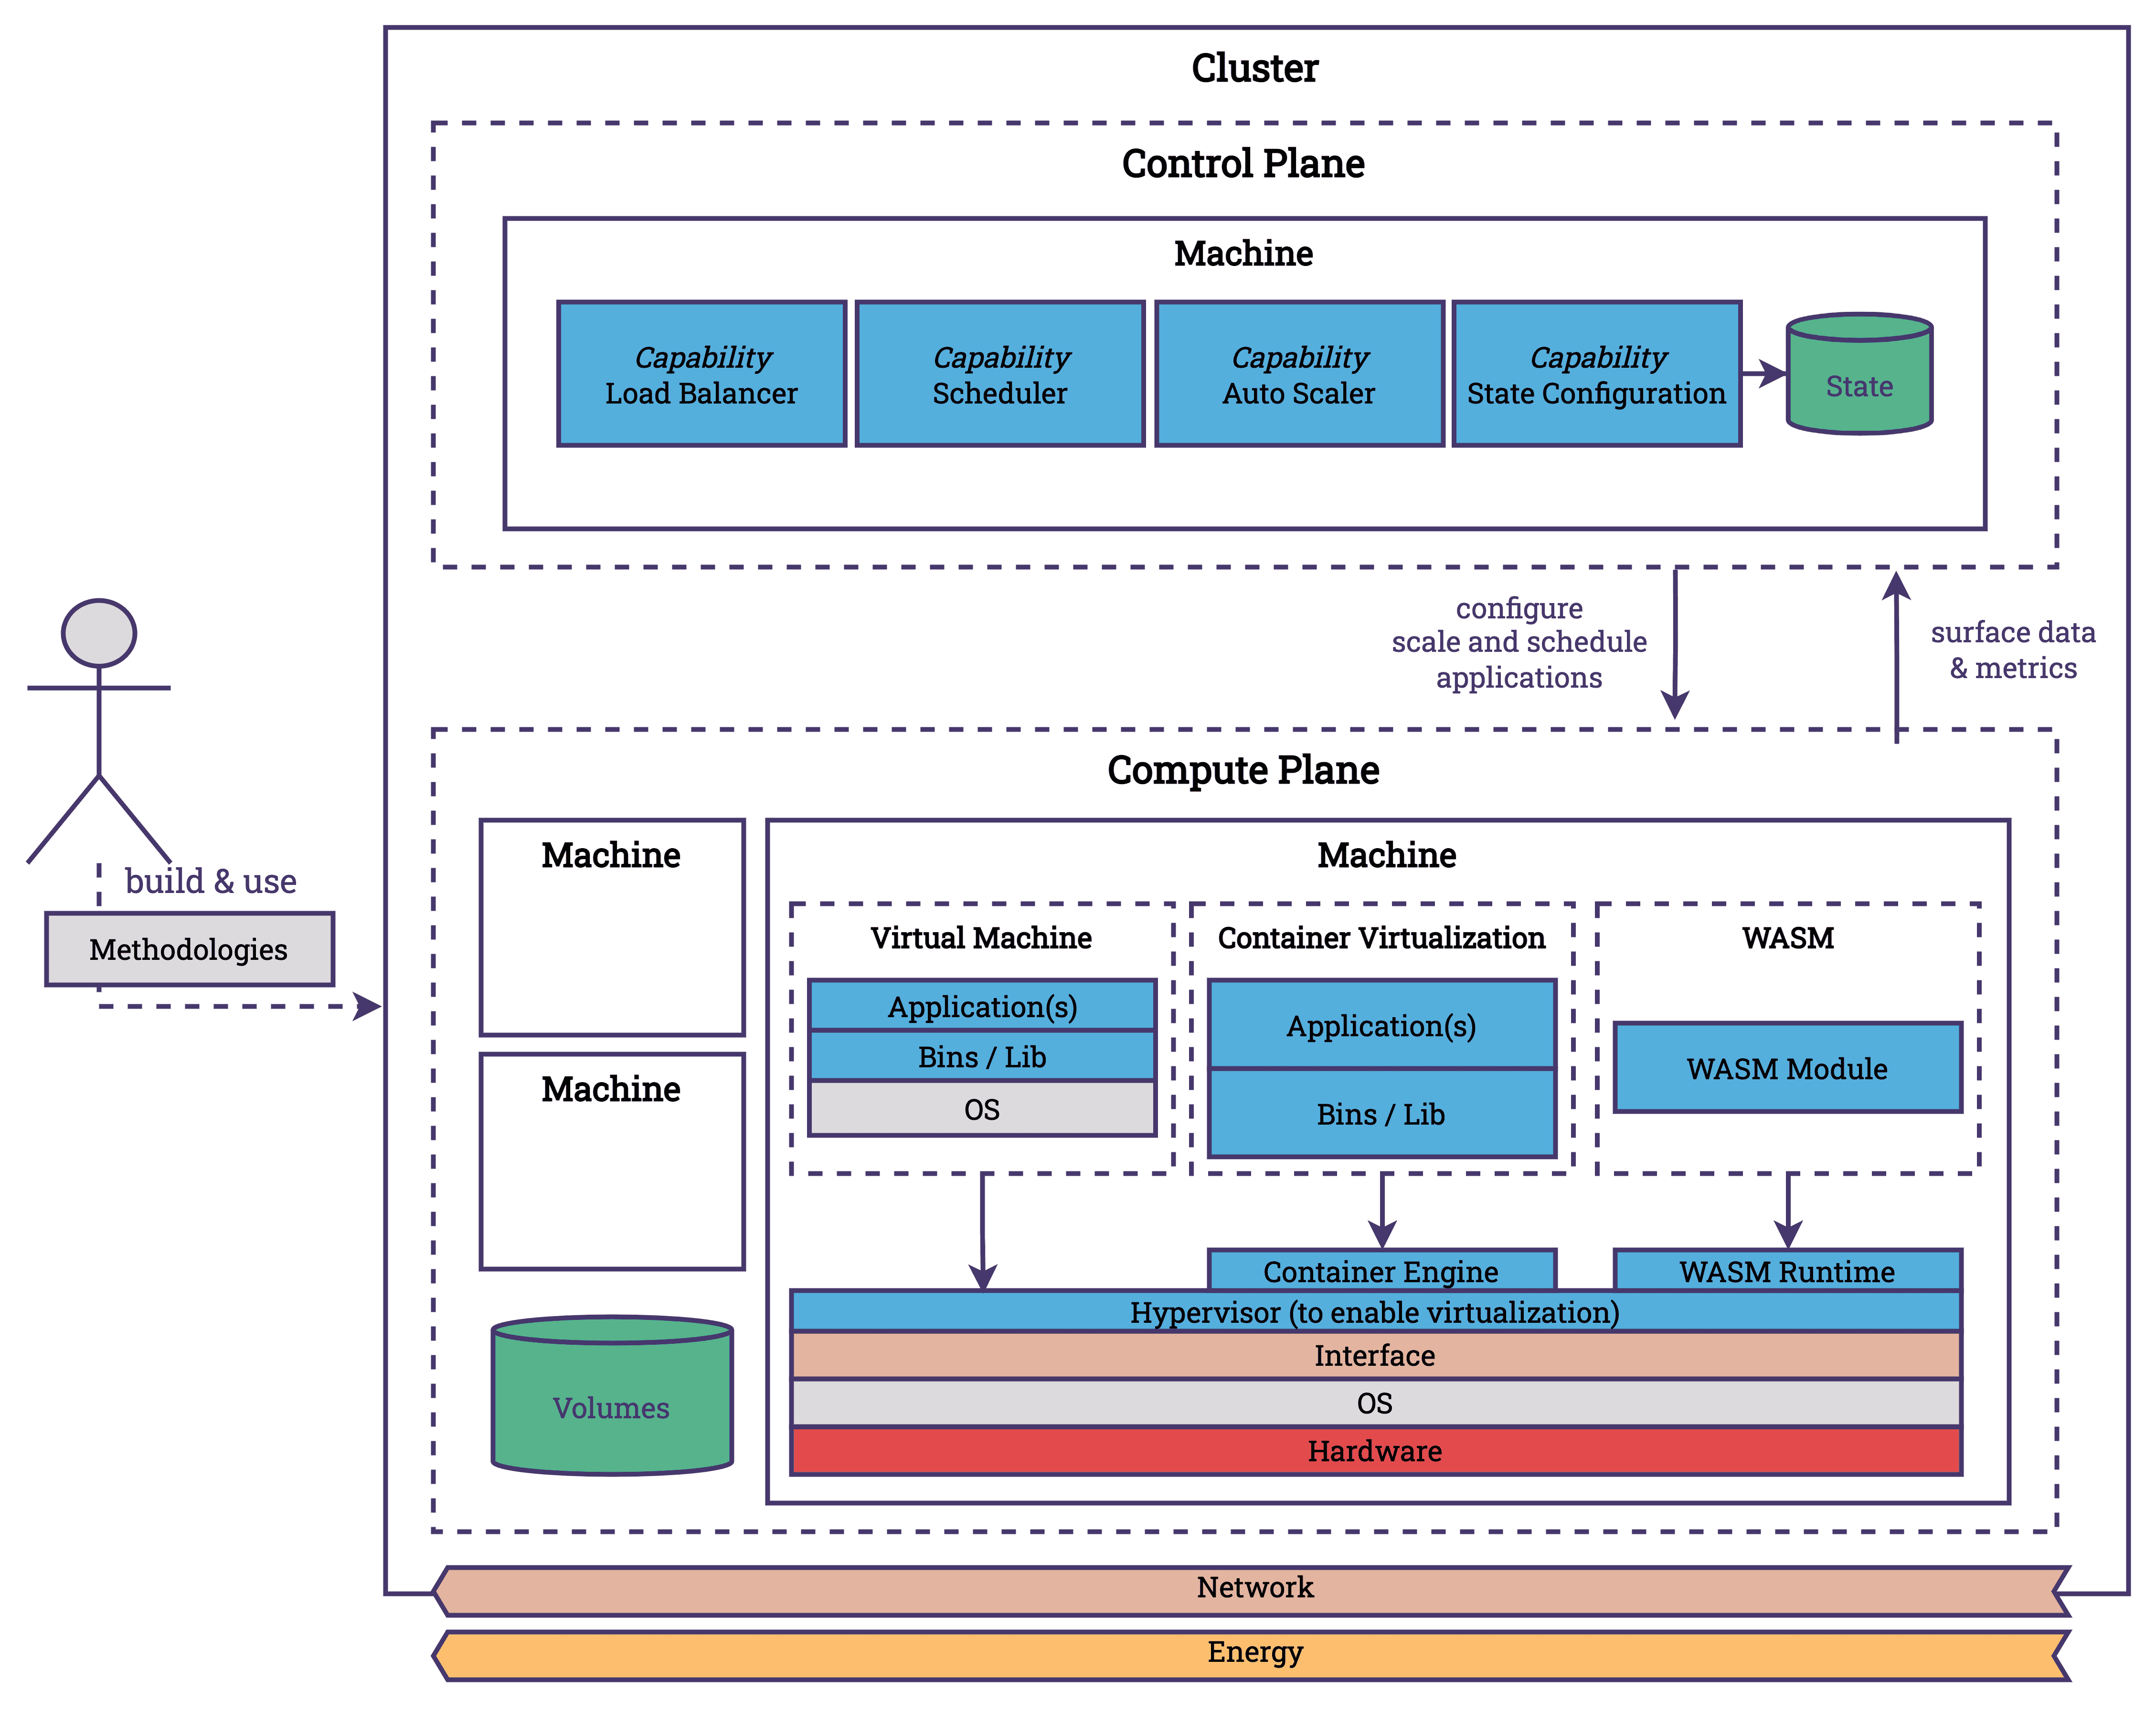
At the hardware level, manufacturers provide APIs for broader system management, including energy usage monitoring features, in compliance with industry standards like IPMI (Intelligent Platform Management Interface). Linux and other operating systems (OS) are responsible for mediating between application requirements and hardware capabilities. Making the best use of the available hardware resources requires the OS to set the correct CPU frequency, enable and disable cores, and put hardware components into on, off, sleep or idle states. This affects systems energy consumption. Linux provides interfaces, such as the /sys/ file system, that user applications can access to manage energy settings and request low-power modes. At the next level, user applications can record these metrics and compare them with other system data, such as CPU usage or process information, which can enrich the data collected. We know more about the software we use at the user level than we do at the hardware or operating system level, which lets us add semantic metadata to the data. If we continue to move up the stack, we will deal with a distributed cloud system that is about energy management. Each node has monitoring agents that collect energy metrics and send them back for central analysis. At the cluster level, it is possible to enhance the data gathered by incorporating knowledge of the infrastructure's topology and inter-node communication patterns.
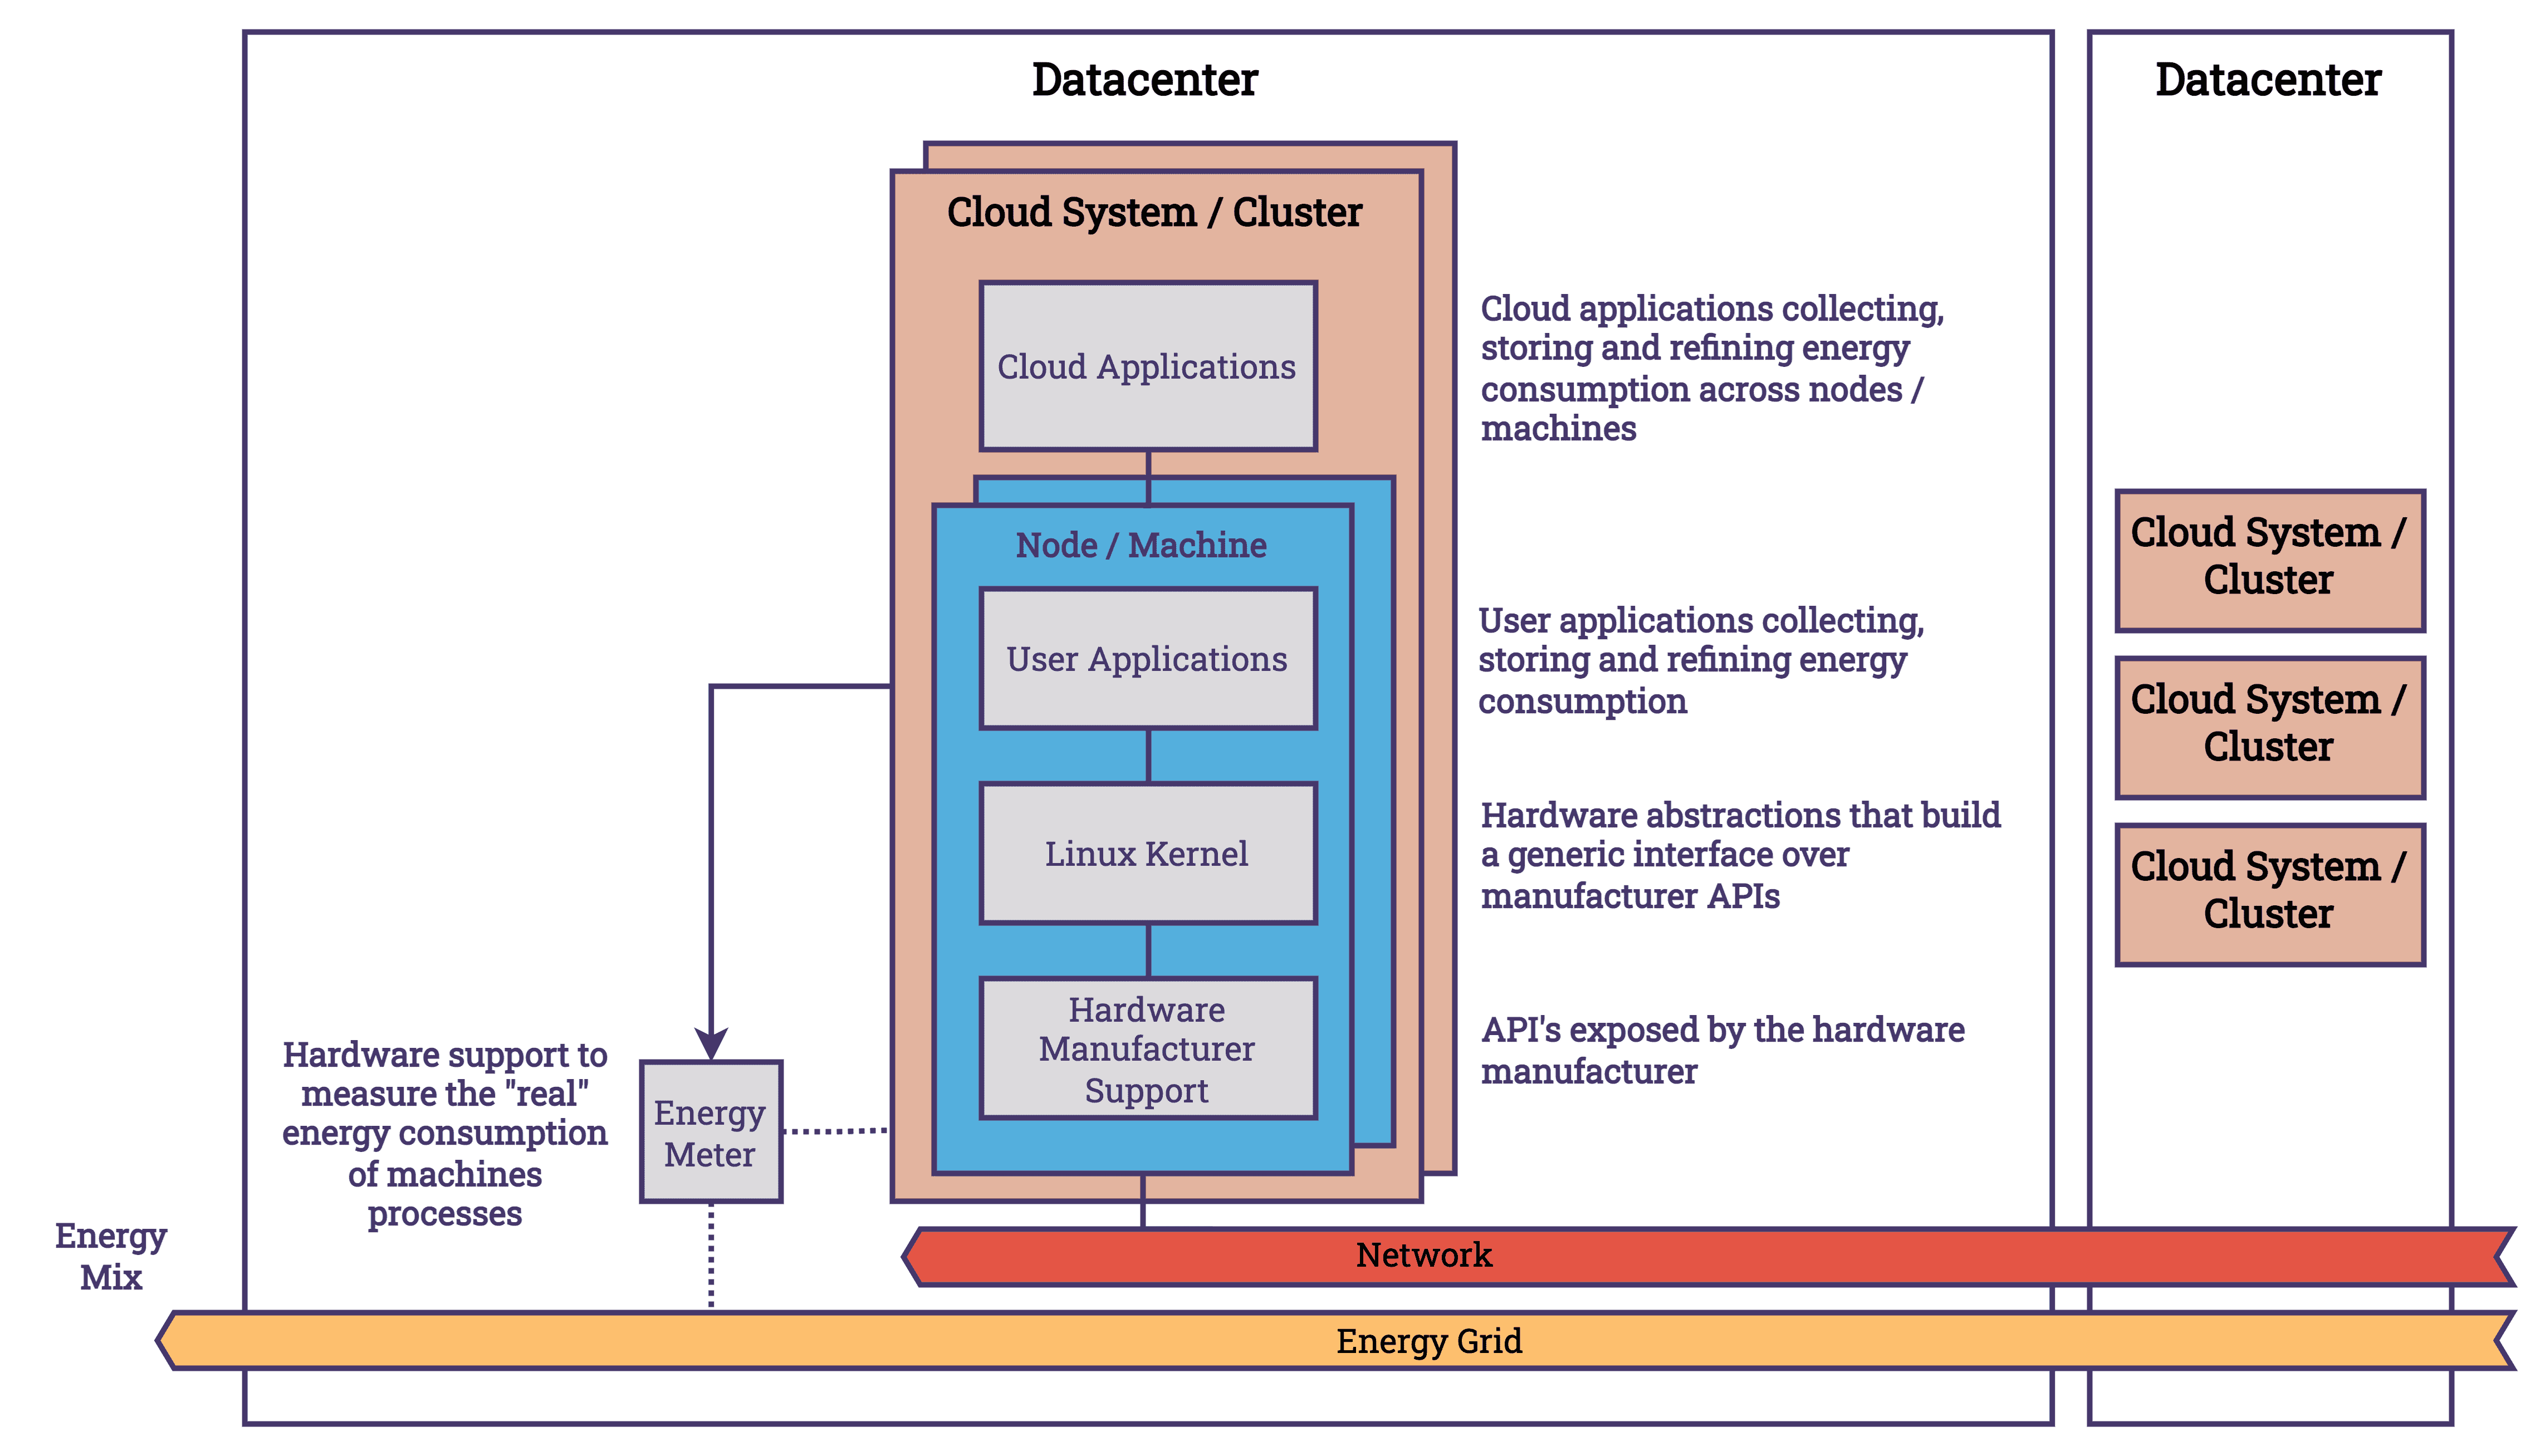
A simplified overview of the key abstraction layers involved in measuring energy use within cloud computing can be found in the diagram. It serves as a reminder of the importance of separating concerns and its impact on aggregating energy consumption across various levels. Despite the fact that these abstractions present challenges in accessing data, owing to the necessity of coordinating multiple components and vendors, they also facilitate the level of sophistication and complexity required for further innovation. The presence of these layers facilitates the creation of solutions that are both more efficient and effective. Let’s take a look at each layer and how they connect to each other.
Hardware / Chip manufactures
Among chip architecture, different energy measurement APIs exist. Let’s take a look.
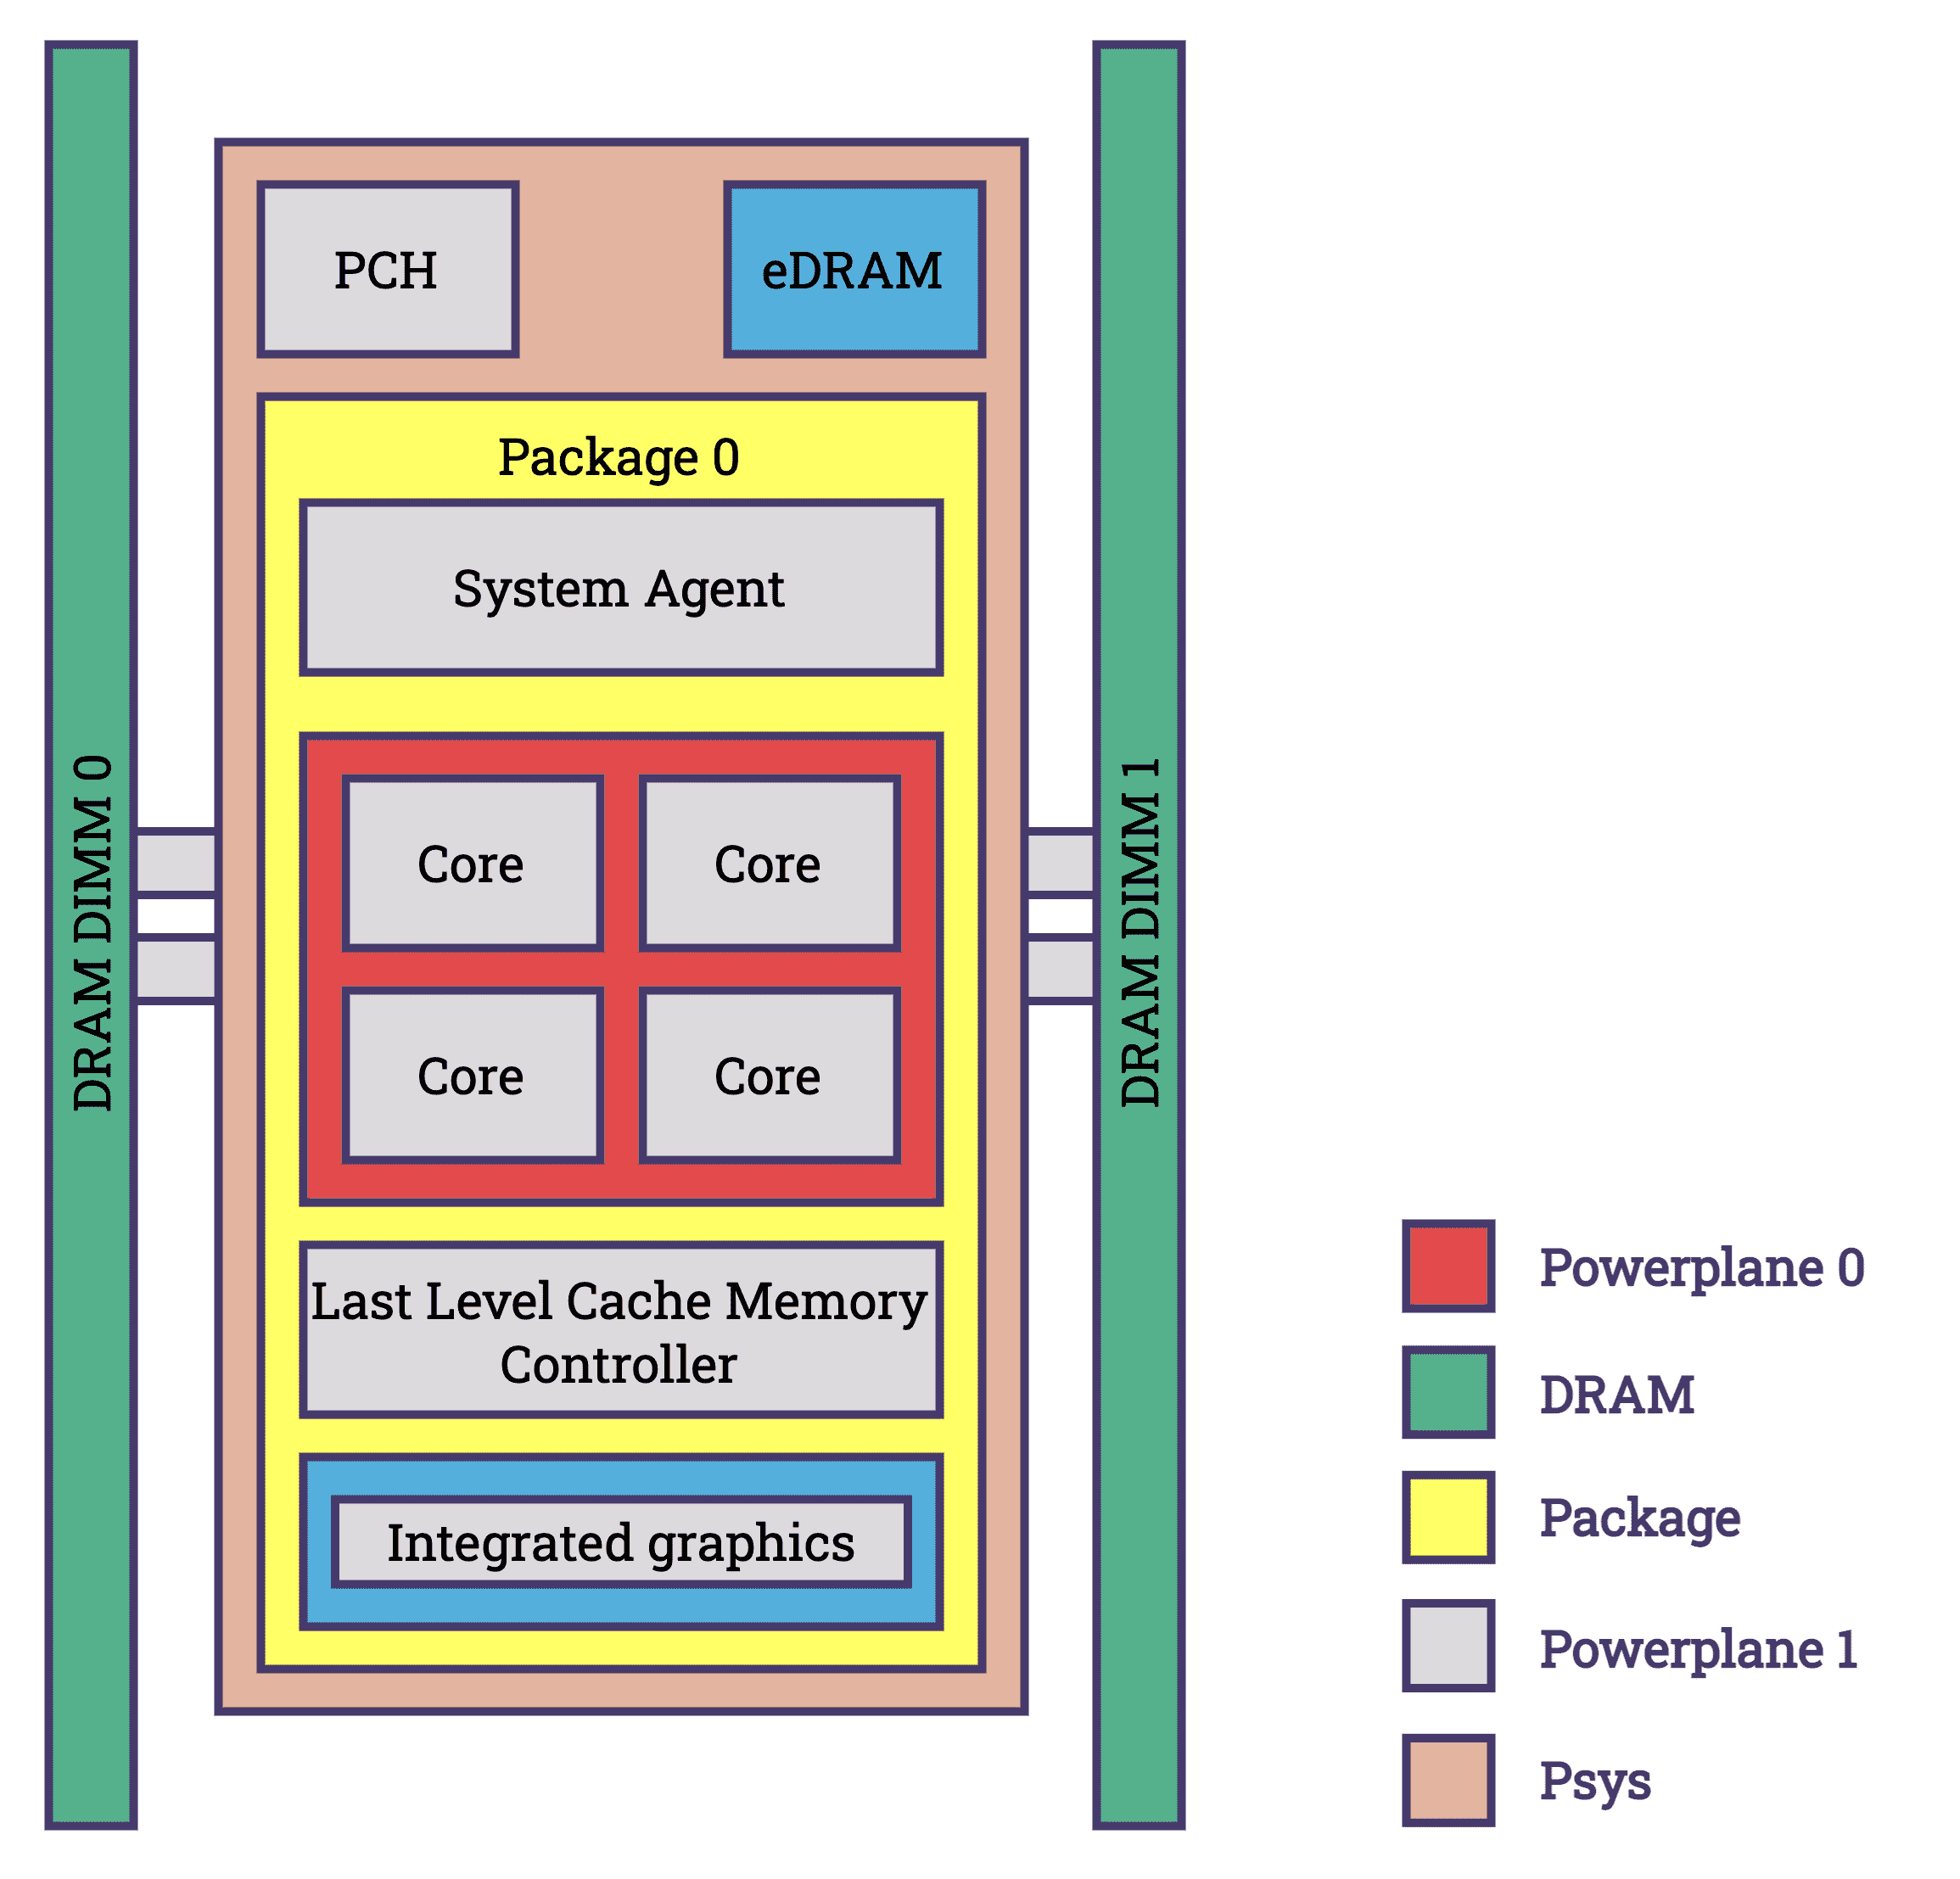
- Intel: Intel's chips have included the Running Average Power Limit (RAPL) feature starting with the Sandy Bridge architecture in 2011. Initially designed to enable BIOS and operating systems to set virtual power limits, RAPL also facilitates the measurement of energy consumption. Over subsequent iterations, RAPL has expanded to encompass a broader range of energy-drawing components across various packages. Components covered by RAPL are shown in the diagram below. RAPL provides precise energy consumption measurements with a minimal margin of error [source].
Power domains supported by RAPL [source]
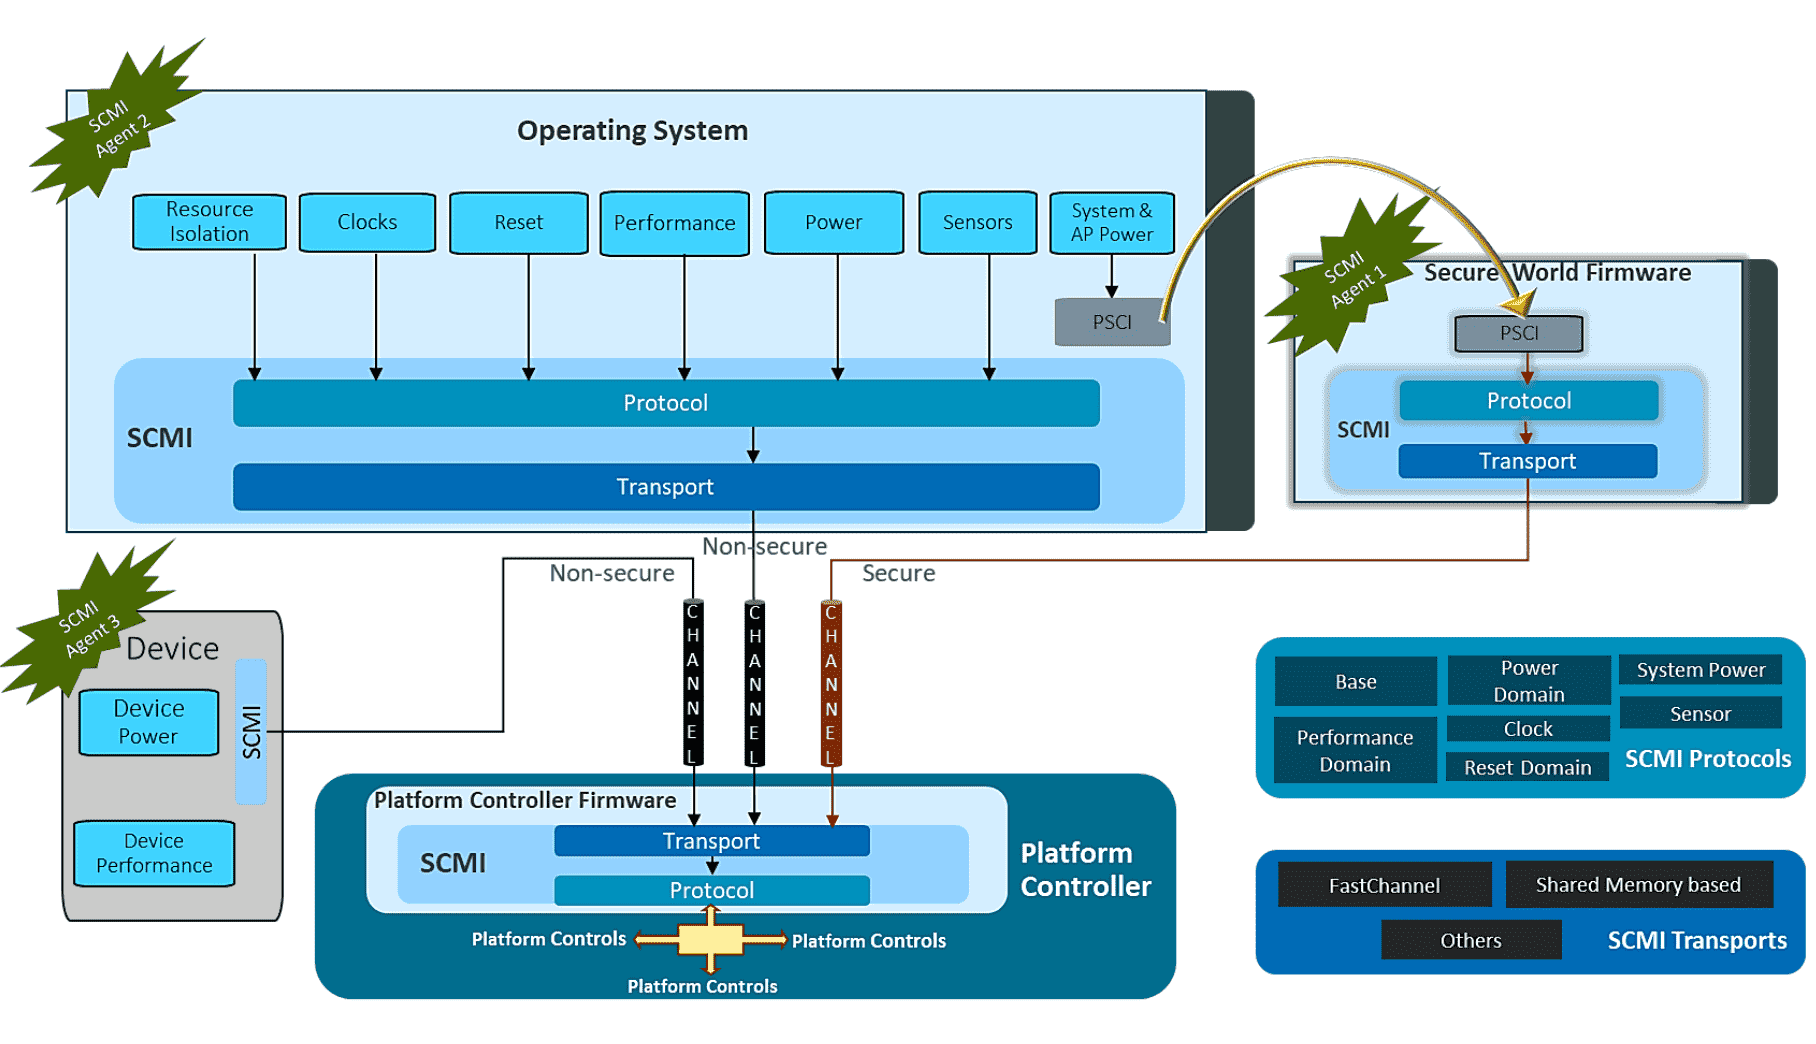
- ARM: ARM is unique in that it designs the architecture for system-on-a-chip configurations, which integrate components such as the CPU, DRAM, and storage. ARM does not build these chips itself, but licenses the designs to manufacturers such as Qualcomm. As a result, variations among chips, including differences in power measurement capabilities, exist. ARM has introduced the System Control and Management Interface (SCMI), which allows manufacturers of ARM chips to report energy metrics, among other metrics [documentation].
- AMD: AMD's approach aligns with Intel's, incorporating power tracking into its chipsets through an API similar to RAPL called APML (Advanced Platform Management Link), enhancing its ability to monitor power use, particularly in energy-sensitive mobile and IoT devices (see handbook. AMD also builds Kernel drivers to report in RAPL, see
amd_energy). - NVIDIA: NVIDIA offers with the System Management Interface (SMI), a command-line based tool that enables tracking and adjustment of various GPU parameters, including power consumption [documentation]. NVIDIA also exposes an API called NVML which is built on smi [documentation].
As previously mentioned, these industry standards, rely on software-based methodologies that approximate energy consumption. While software approximations are useful and get close to the real number, they are not direct measurements and therefore may not capture the complete picture of actual energy usage. This becomes clear looking into NVIDIA’S SMI toolkit.
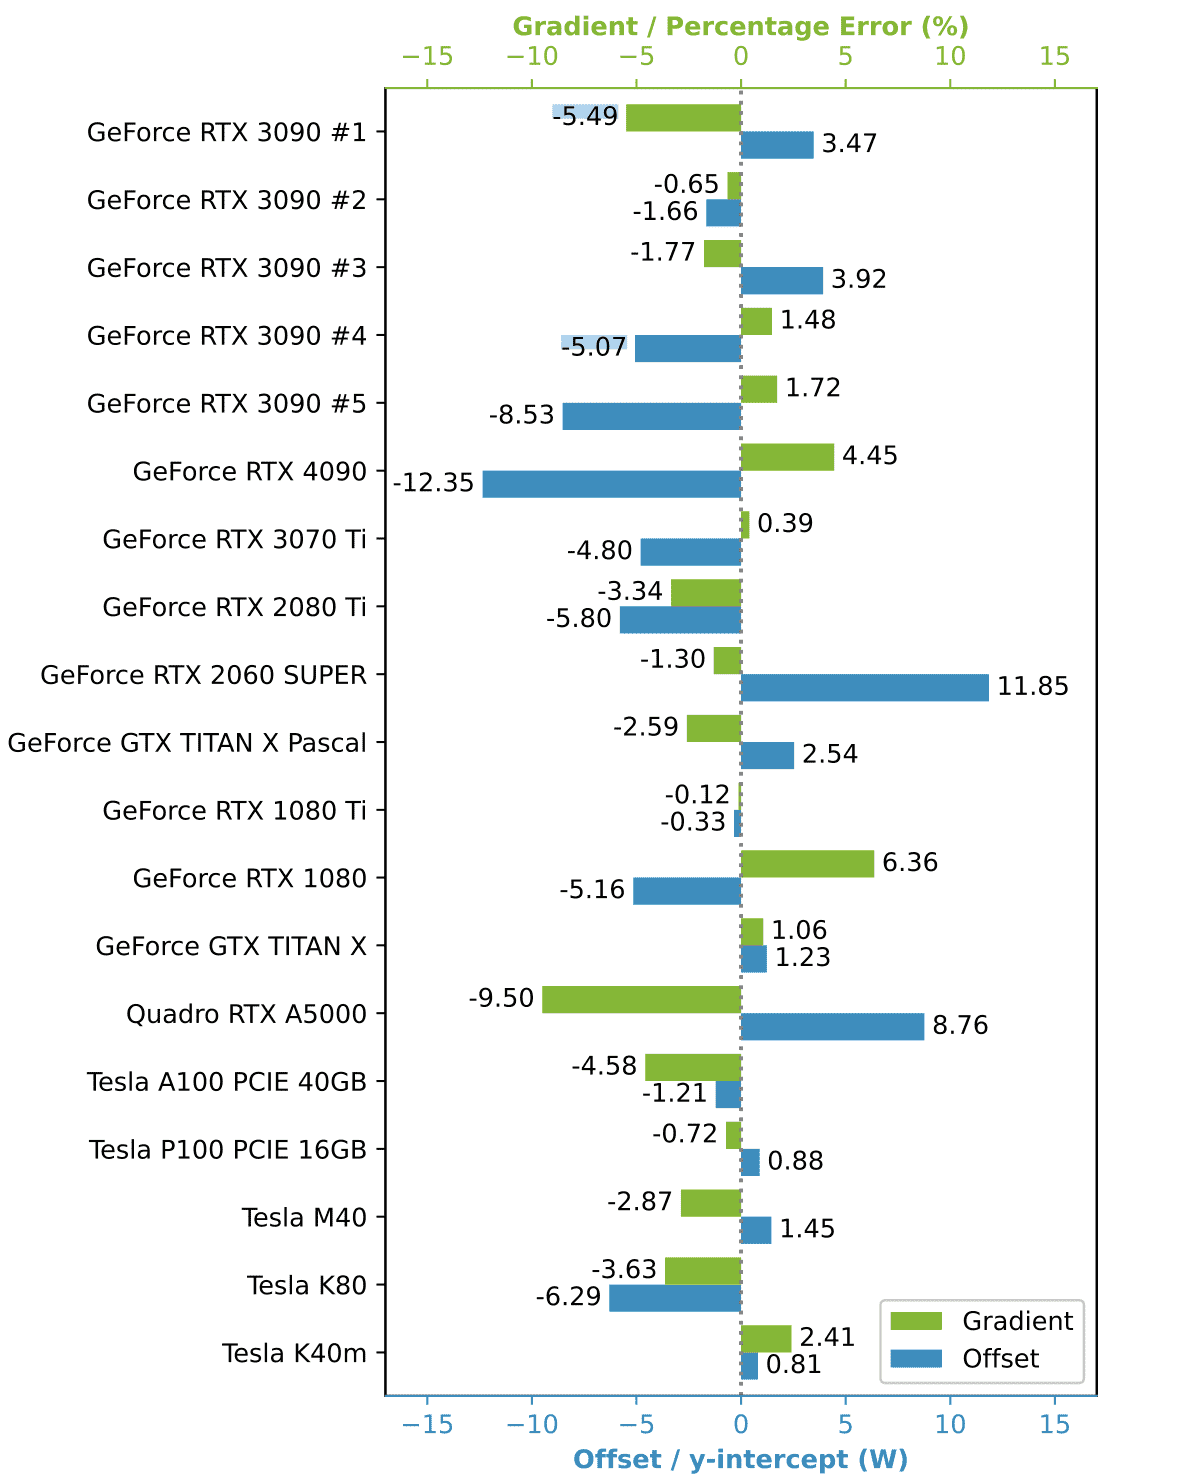
A study from March 2024 examined the accuracy of NVIDIA's nvidia-smi tool in measuring energy consumption [source]. The chart provided illustrates the need for distinct offset calibrations for each GPU model to adjust energy consumption readings accurately. Additionally, a gradient is shown for each model, indicating a significant inherent measurement error that results in either overestimation or underestimation of energy use. This demonstrates that although it is feasible to obtain precise energy metrics based on software approximations, the collection of such metrics is challenging. Moreover, layers that rely on these measurements will be able to operate with measurement errors generated in preceding layers.
In addition to energy-related metrics, resource metrics such as lifetime, expected lifetime, embodies natural resources and effective degree of utilization (among others) will also play a role in the future. Plus, a focus on the usability of hardware for future software iterations so that old hardware remains usable with new software.
Operating System — Energy Management in Operating Systems on Linux
In general, operating systems (OS) facilitate the interaction between hardware capabilities and application requirements. As with the previous hardware layer, there are different vendors. However, there is a larger focus on UNIX and Linux-based systems, since they are most spread in datacenters. The OS orchestrates the management of processes and file systems, oversees memory allocation, and regulates access to hardware resources, ensuring efficient operation and security. With this, operating systems are responsible for configuring how to leverage hardware resources best, which influences energy usage. It is also responsible for managing thermal performance, which is caused by energy consumption (Dynamic Thermal Power Management (DTOM)). The Linux Kernel has detailed documentation about their power management features [documentation].
Linux power management employs two principal strategies—static and dynamic—each designed to optimize energy efficiency while addressing different operational needs:
- Static Power Management: Establishes a fixed power configuration from the start, such as disabling unused devices, that does not adjust according to the system's workload. While this approach ensures a consistent power usage profile, it may not be as efficient under varying operational demands due to its lack of responsiveness to changes in system activity.
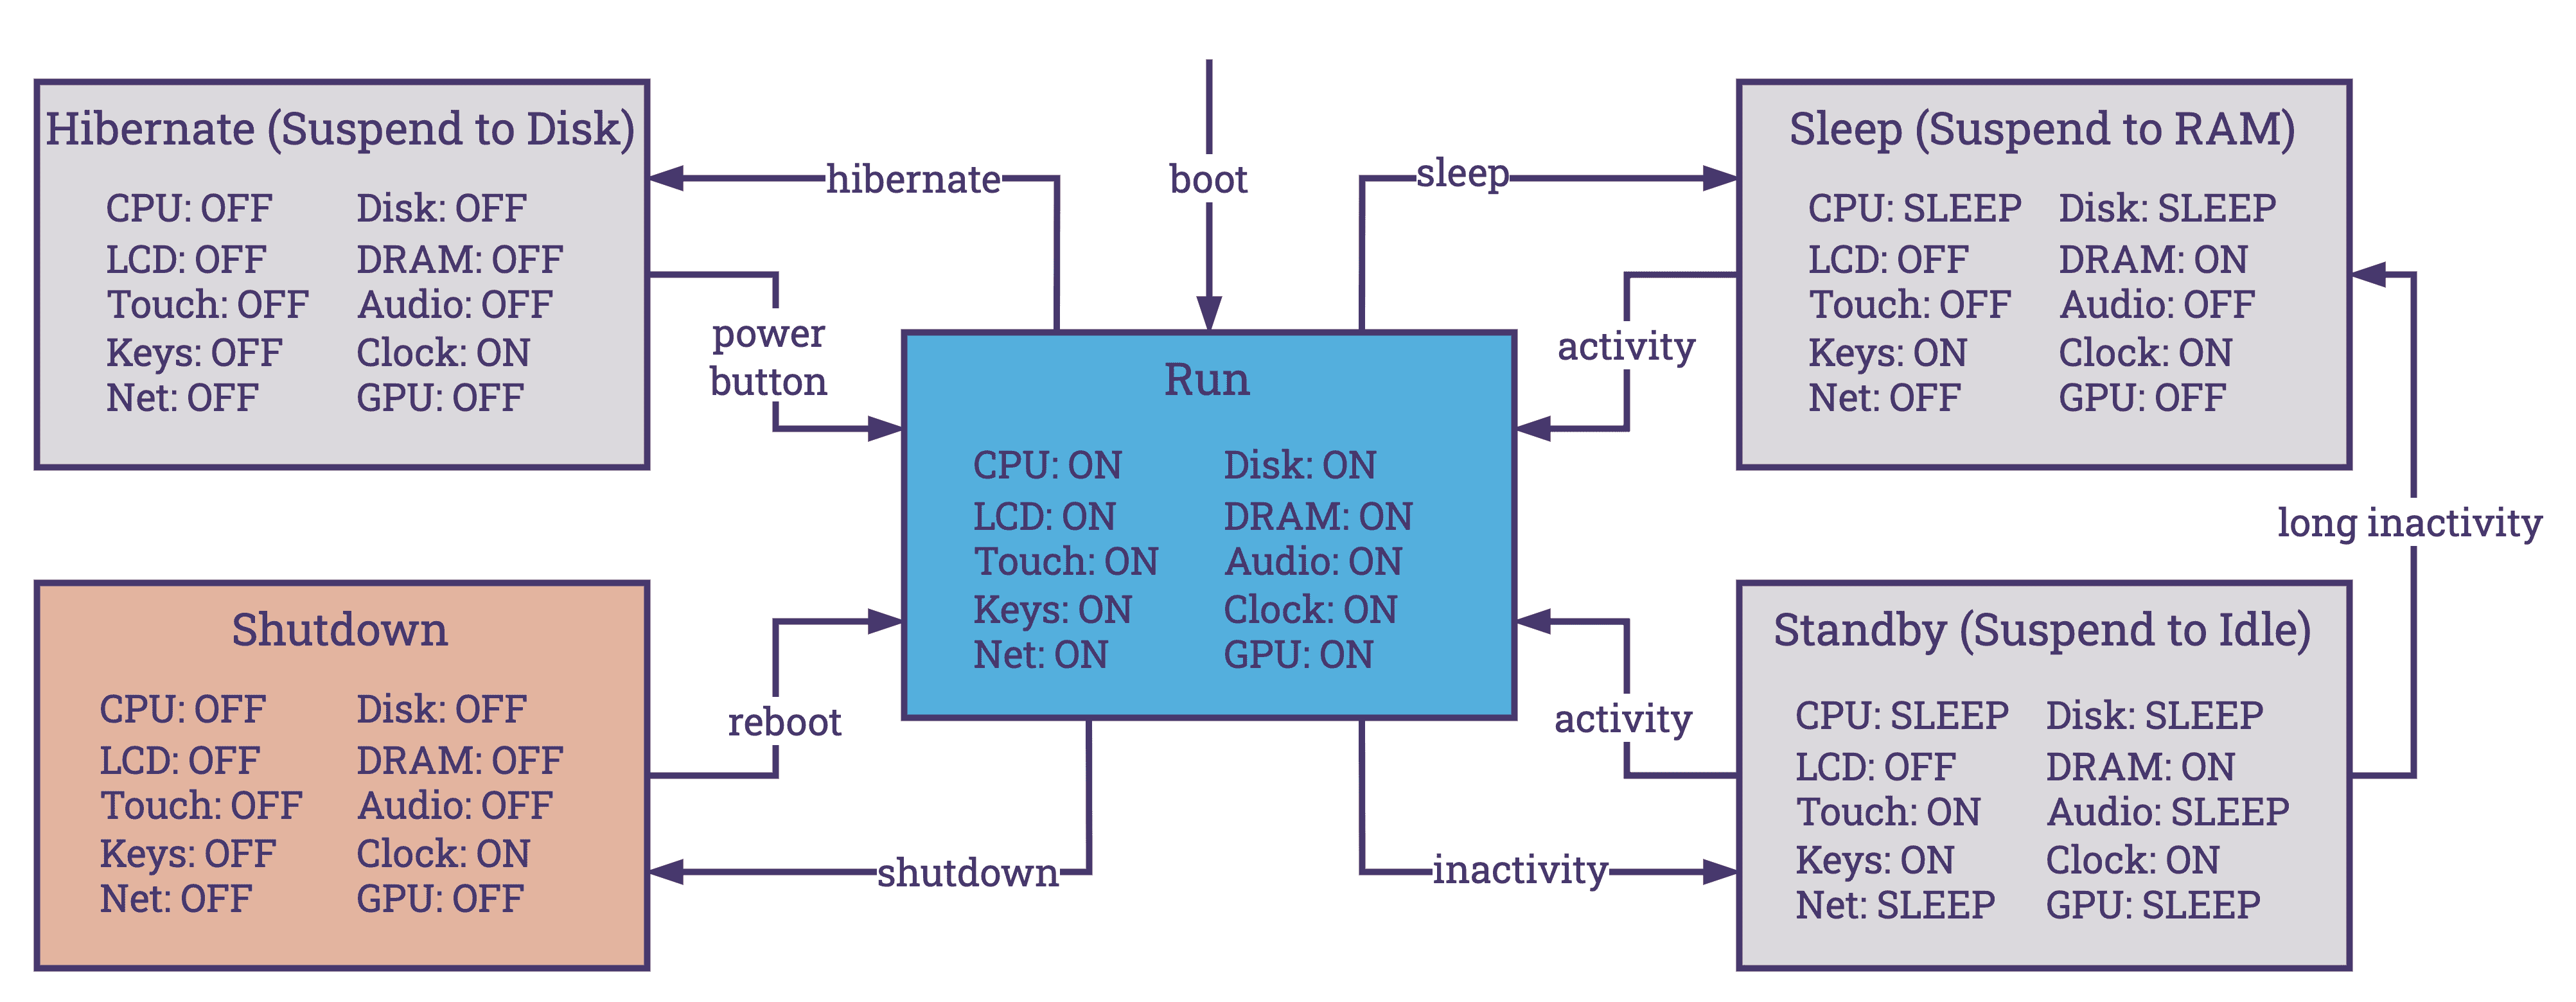
- Dynamic Power Management: A more sophisticated approach that enables the operating system to dynamically respond to the system's needs. This involves adjusting the power states of hardware devices (e.g., ON, OFF, STANDBY, SLEEP, HIBERNATE) and modifying CPU performance characteristics through techniques like Dynamic Voltage and Frequency Scaling (DVFS). It also includes selectively enabling or disabling hardware components, such as CPU cores, based on real-time workload analysis. The implementation of ACPI, alongside other dynamic management techniques, allows Linux to adapt its power management policies to the current state and demands of the system, optimizing energy usage, performance, and Quality of Service (QoS)
There are different ways to interact with energy management settings on Linux:
- System Interfaces: Linux exposes detailed system and hardware information, as well as control interfaces, through special file systems such as
/sysand/proc. These directories allow users and applications to query system metrics and adjust settings related to power management. For example,/sys/devices/system/cpu/cpu*/cpufreq/provides access to CPU frequency scaling settings, enabling control over the power consumption of CPU cores. - Diagnostic Tools: For real-time monitoring and analysis of system performance and power usage, Linux offers utilities like
topandhtop, which display process-level statistics including CPU and memory usage.powertopis specifically tailored for power consumption analysis. Additionally,cpufreq-infoprovides detailed information about the CPU frequency scaling, including available governors (different strategies when it comes to CPU frequency scaling) and current frequency settings. These tools are great for identifying power-hungry processes and fine-tuning system performance and energy efficiency. - Perf: Linux supports “perf events”, a powerful performance analyzing tool set that includes energy-aware profiling capabilities.
perfcan monitor a wide range of hardware and software events, offering insights into system behavior that can be leveraged to optimize power usage further. Perf events will be mentioned again in the next article when it comes to exploring the concept of using eBPF to enhance energy consumption monitoring.
Userland
At the application level, we can split the landscape in different ways. One option to look at the landscape would be to categorize it into two main types of applications: those that gather data about energy and those that use the data gathered. Alongside these applications, methodologies exist that define APIs, standards, and patterns that help us connect our services better.
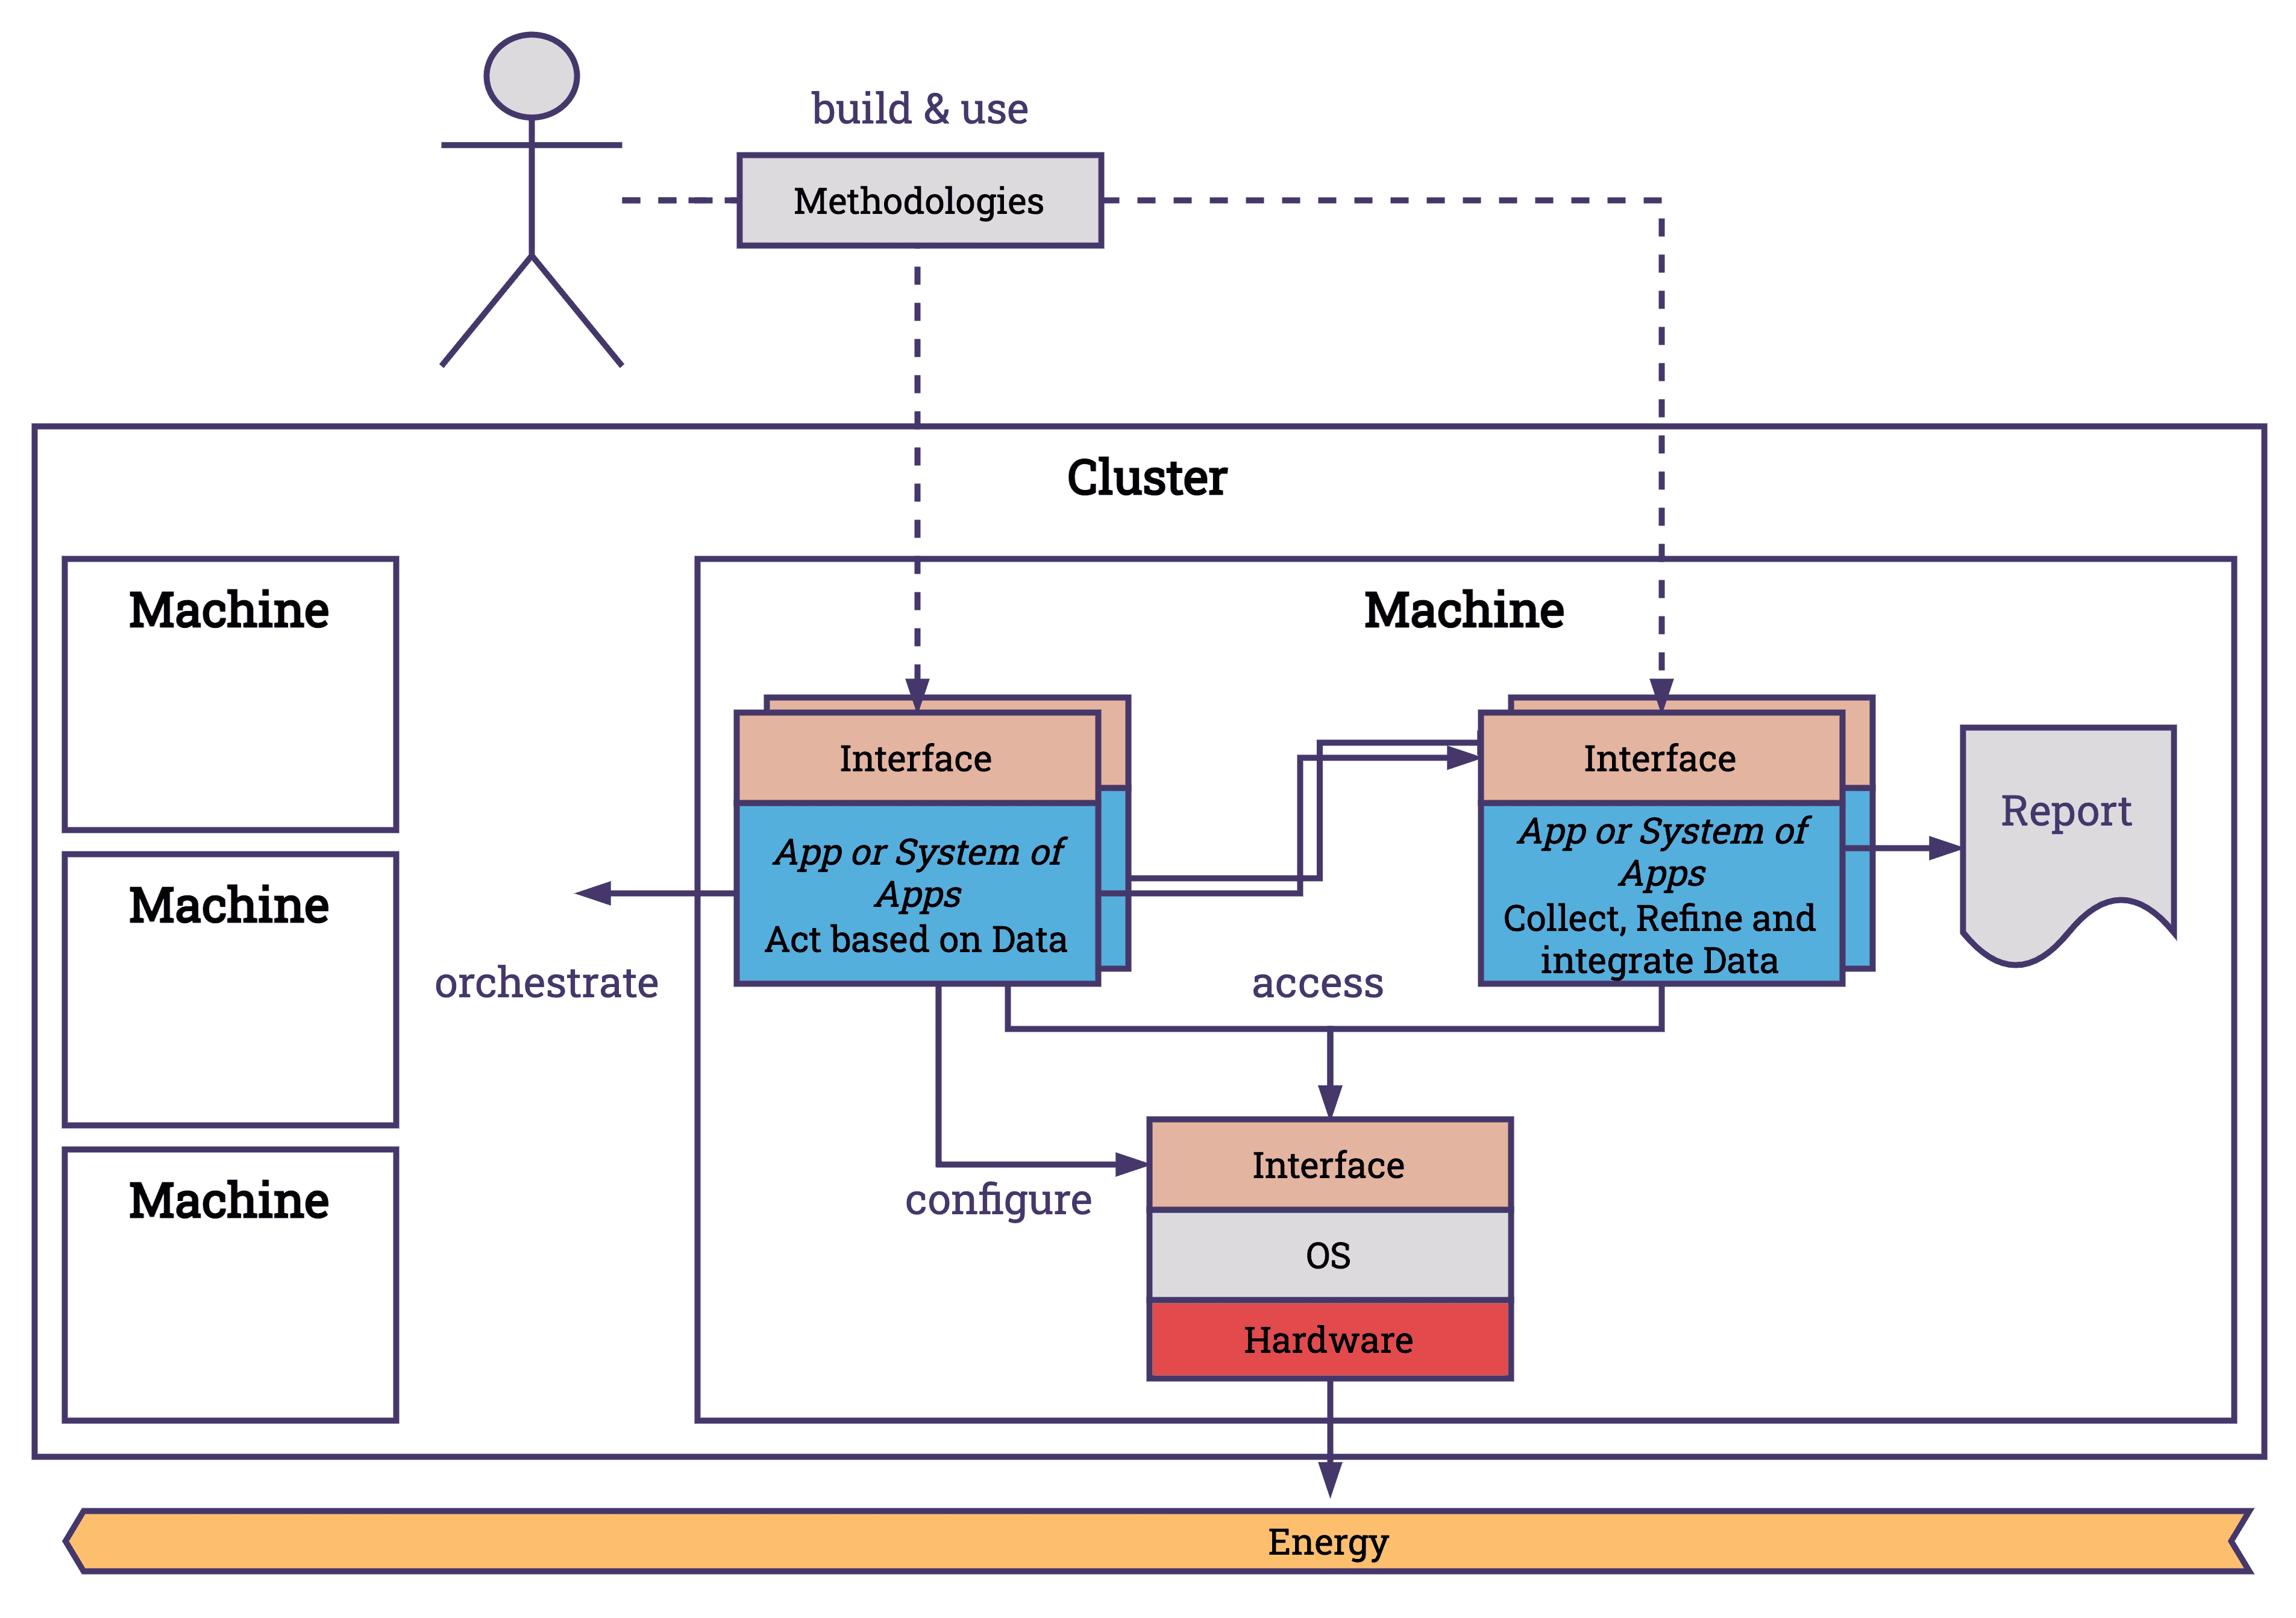
- Methodologies: These are the frameworks and approaches that define how applications are developed, including the APIs that facilitate communication between different software components.
- Applications that Collect Data: These applications or systems of applications focus on gathering information from various endpoints. A common use case is to collect the energy consumption of the system and estimate the carbon footprint based on the location and the energy mix. Collecting data, refining the data and creating higher value data is the target for applications in this category. As an example, the project Scaphandre integrates different APIs like RAPL to gather a comprehensive overview of energy metrics. These metrics are refined and exposed in different formats over a digestible endpoint, which makes integration with other projects like Prometheus and Grafana easier.
- Applications that Act Based on Data: This category includes applications that process and utilize the collected data to make automated decisions, optimize operations, and improve energy efficiency. Since the OS takes the heavy load of mediating energy consumption of applications, this obligation is already taken care of and does not need to be fulfilled by applications. It is possible to configure the OS over applications; however, I have not seen plenty of projects do that. Therefore, applications that are making decisions are usually designed for another abstraction layer that is unreachable of the OS — the cloud.
Cloud & Cluster
In the cloud, our focus shifts towards the orchestration of applications across numerous machines. At this level, our concerns include scalability, resiliency, and latency, among other factors. To efficiently allocate hardware resources among various applications, we employ various virtualization techniques. This approach allows for the virtualization of components such as CPUs, storage, and network resources (et al.). We utilize technologies such as Virtual Machines, Containers, and emerging technologies like WebAssembly (WASM) to provide isolated environments for hosting applications on these machines. Virtualization is performed at the operating system and user level and is leveraged heavily by the cloud. Virtualization is great because it allows us to share and use resources better, which in turn improves utilization and reduces energy consumption.
[SIDE NOTE] To effectively manage large numbers of computers—ranging from hundreds to thousands—we depend on a robust data center infrastructure. Machines often integrate with standardized interfaces such as the Intelligent Platform Management Interface (IPMI) and Data Center Infrastructure Management (DCIM) standards. These standards assist in configuring energy consumption and in monitoring hardware health and managing system events across different platforms, independently of the operating system. This capability enables remote management of power states, supporting actions like rebooting or shutting down systems to conserve energy under certain conditions.
Kubernetes, along with other orchestrators, simplifies these complexities within the cloud environment. You may have heard that Kubernetes can be considered to be the operating system of the cloud. Kubernetes facilitates the interaction between infrastructure capabilities and platform requirements. Like Linux, Kubernetes has developed practices and interfaces that have evolved into standards, building an ecosystem of tools that extend its functionalities. These cloud operating systems efficiently distribute applications across available resources, scale applications in response to fluctuating demands, manage service connectivity, and configure resources to match an expected state, among other tasks. How does this relate to energy consumption?
- Scaling: Scaling is fundamentally about adjusting the capacity of applications to meet current demands, which plays a significant role in terms of energy consumption. Efficient scaling minimizes unnecessary resource usage, thereby conserving energy. For instance, KEDA allows scaling deployments to 0, minimizing the resource consumption. Or Karpenter which allows Kubernetes to scale not just pods but also nodes.
- Scheduling: Scheduling involves allocating tasks or applications to the most appropriate resources available. It impacts energy consumption by ensuring that workloads are placed on nodes in a way that maximizes resource utilization and minimizes waste. Applications that communicate a lot with each other can be placed next to each other, or resource intensive tasks can be performed when an excess amount of energy is available (which happens with renewables). Scheduling is also about shipping new versions of applications when it is required and not all the time. Deploying new versions of software every day should not be necessary (for the vast majority of systems). KubeGreen would be an example project that focuses on energy aware scheduling.
- Configuration and Tuning: This aspect is about the adjustment of system settings and application parameters to achieve optimal performance and resource usage. It is about setting up the nodes with applications, so the control plane is aware of key metrics, that applications deployed on the machine have a minimal footprint. Reducing the container image size, using ARM instead of x86, doing smart updates of dependencies.
Due to the distributed nature of cloud systems, an important consideration in scaling and scheduling is networking. The very existence of distributed systems is to tackle use cases that are not feasible without the combined effort of interconnected machines. Understanding communication patterns is crucial when scaling and scheduling services to ensure efficiency and effectiveness.
Beyond Standard APIs: Designing Comprehensive Energy Measurement with eBPF
What is the responsibility of an orchestrator in the cloud / the OS of the Cloud
Let’s reiterate over the responsibilities of an orchestrator such as Kubernetes in the cloud. This will help us understand which metrics we should collect at this abstraction level. We don't need to deep dive into Kubernetes' functionalities too much; a high level overview of its capabilities should be enough. Kubernetes facilitates the interaction between infrastructure capabilities and platform requirements.
If there is a change in demand of services, it scales the service up or down (scalability), if a new version of an application get’s release it manages updating the pods on nodes (roll out) and reverts the change if an problem occurs (rollback), it detects if a pod crashed and restarts the pod (self healing), if a new deployment is configured it starts pods in its nodes (scheduling), it manages communication of it’s services (egress, ingress over services & network policies), it ensures that deployments are in the specified desired state (declarative configuration), it allocates virtual storage to pods (persistent volumes), it routes traffic between available pods (load balancing), etc.
There are a lot of more capabilities - everything security related was not even mentioned. But this should suffice for now to continue. In the next step we will take a look at which metrics we currently collect. This will highlight limitations of current practices.
Current State of the Art: Cloud Native Energy Measurement
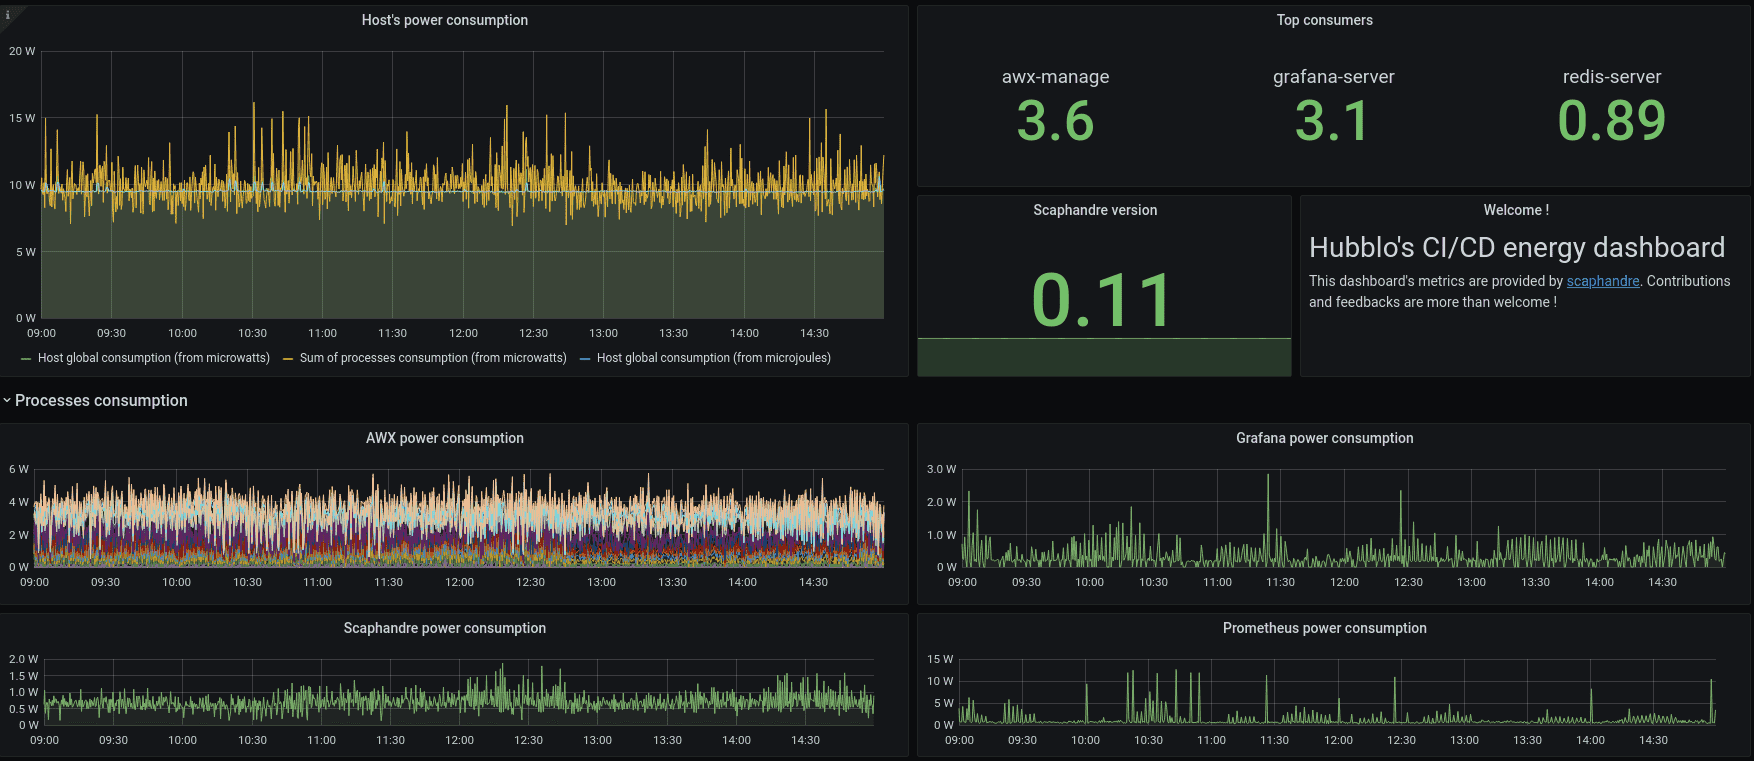
Energy measurement in cloud environments is not yet a widespread practice. Nonetheless, a few tools are currently available for this purpose. For instance, Scaphandre can be deployed on each node within a cluster. It features a Prometheus exporter, simplifying the aggregation of logs across the cluster for visualization in a Grafana Dashboard—a guide and example of which can be found on Scaphandre's project website [guide].
Scaphandre Dashboard Example [source]
Kepler represents another project in this space, offering a higher level of metric detail tailored for Kubernetes environments. It enhances granularity in two primary ways: through the use of machine learning models and the integration of eBPF for energy consumption estimation, as detailed in its [documentation].
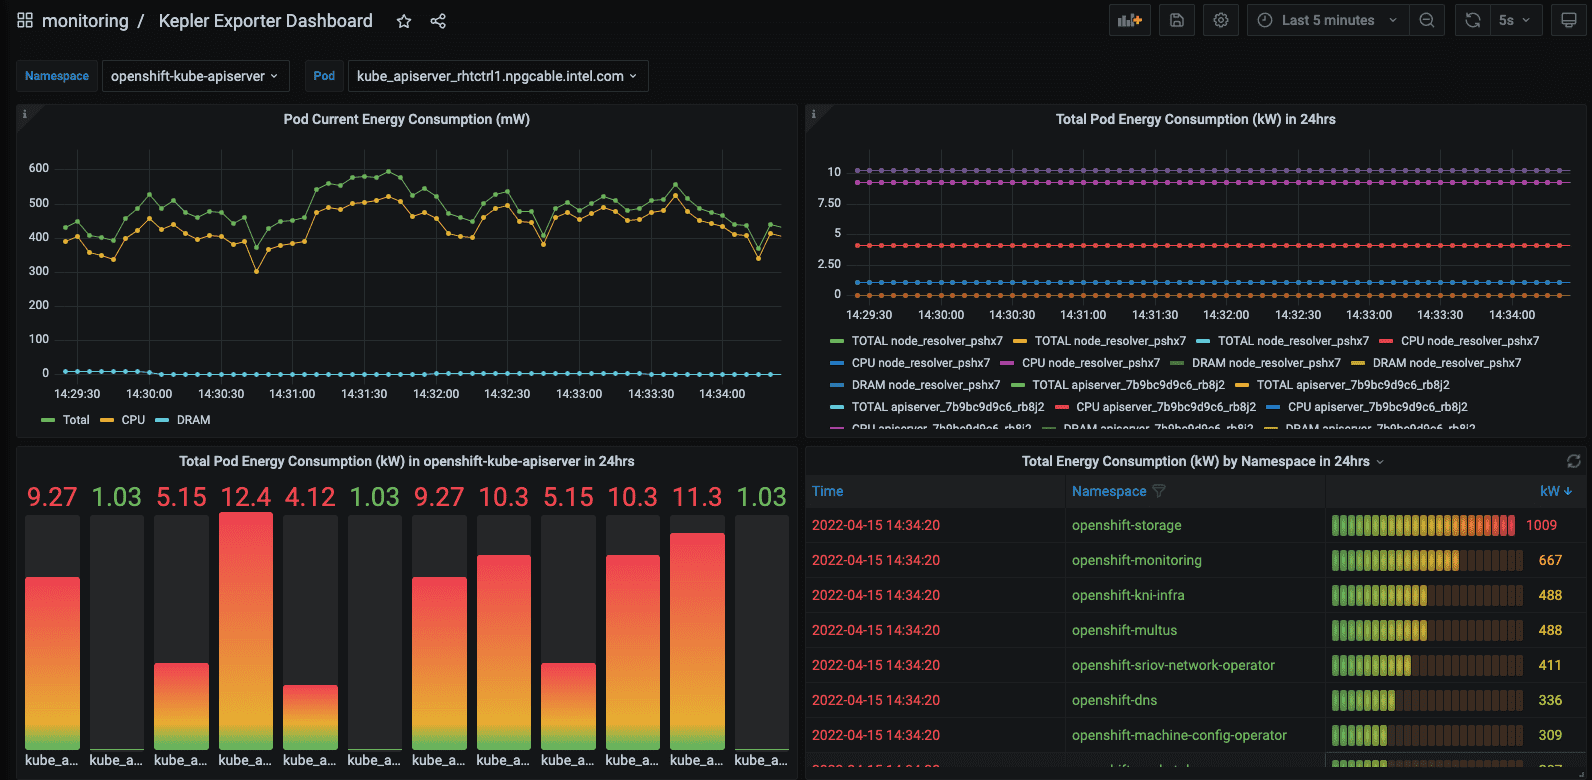
Kepler Grafana Dashboard Example [source]
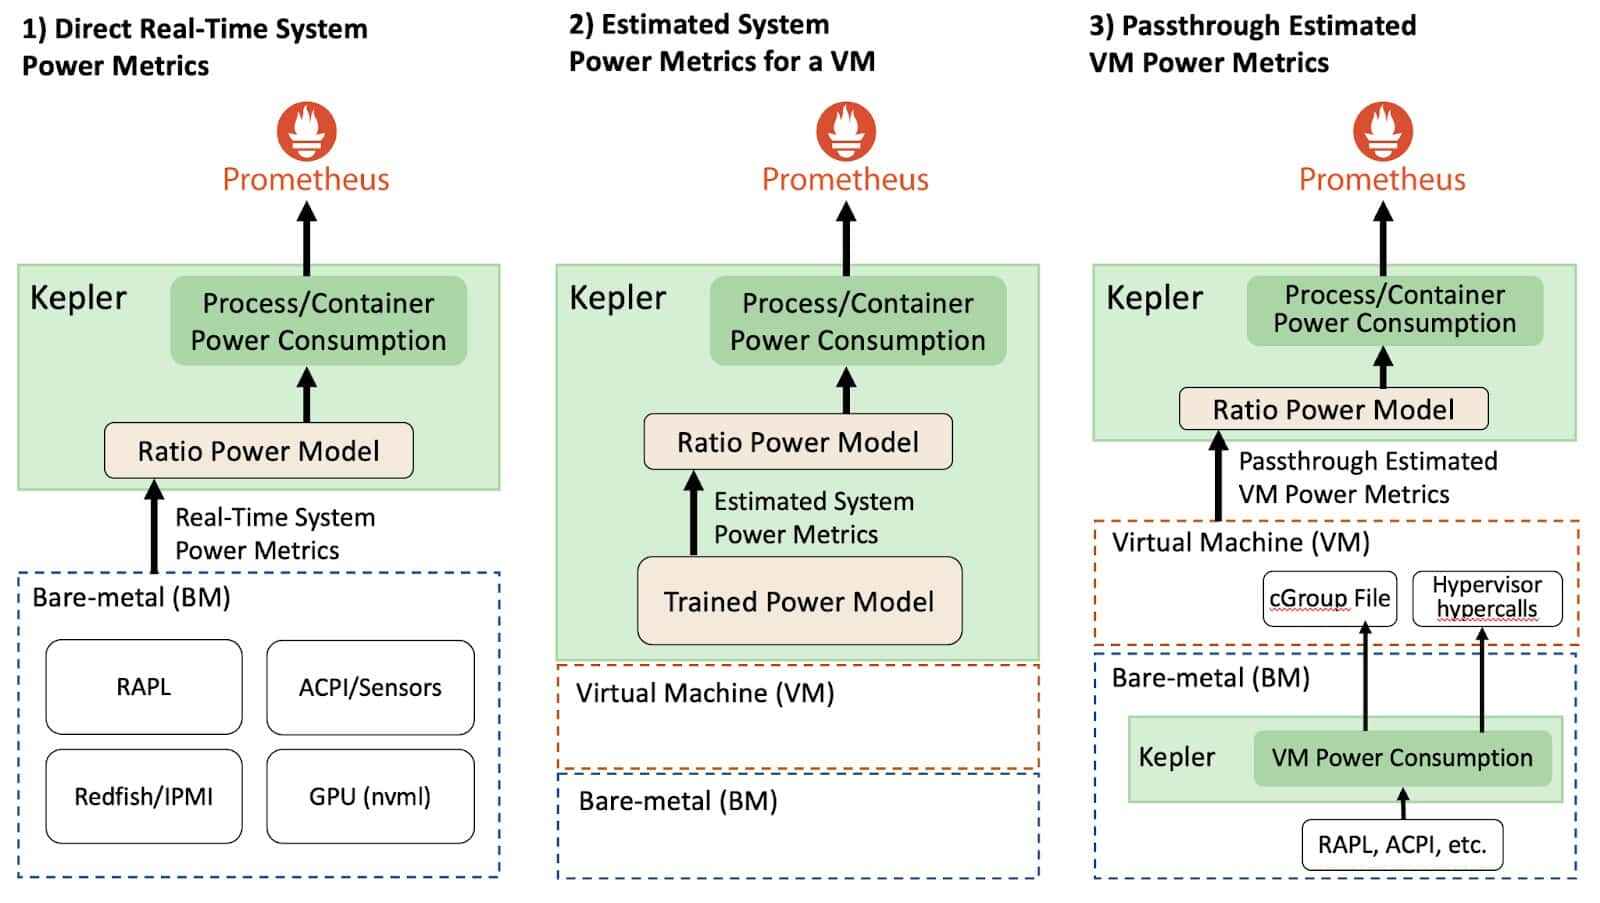
- Use of Machine Learning in Kepler: Kepler leverages machine learning (ML) techniques to estimate the power consumption of virtualized applications when direct access to the bare metal hardware is unavailable [documentation].
- eBPF Utilization: eBPF is used for the acquisition of more granular data. The collected node-level metrics from RAPL, nvidia_smi etc. are getting broken down to pod-level metrics. Kepler employs eBPF to compute these metrics through the analysis of various Linux performance events (perf) [documentation].
Both Scaphandre and Kepler capture relevant energy metrics, with Kepler offering a more detailed analysis, both on a node and pod level. However, the key question is whether the metrics provided by these tools align with our needs to advance cloud-native sustainability within our project system. Can we accurately identify energy consumption patterns in our cloud infrastructure? Reflecting on Kubernetes' capabilities, it becomes apparent that the metrics exposed by Scaphandre and Kepler do not provide clear insights in this regard. Let's envision what our ideal metrics would entail!
Conceptualize Cloud Native Energy and Resource Metrics
In the cloud context, other metrics become particularly relevant, metrics that provide an overview of the system's overall performance. This includes how Kubernetes or any other container orchestrator manages its responsibilities regarding energy and resource consumption. These metrics should be tailored to leverage the capabilities of the container orchestrator. Merely gathering standard OS/Linux metrics related to CPU utilization and energy consumption per process falls short of providing a comprehensive overview or pinpointing issues within the setup. Given Kubernetes' extensive capabilities, many of which could offer valuable insights when correlated with resource consumption and, more specifically, energy usage, it's worth exploring a few examples to demonstrate this approach.
| Metrics | Metric Family Description |
|---|---|
Self healing total_restarts_app_x: counter (captured by K8s), time_restart_app_x: gauge, energy_restart_app_x: gauge |
Metrics related to app restarts, tracking the count, duration, and energy consumption of pod restarts. |
Scalability total_scaleup_app_x: counter, total_scaledown_app_x: counter, time_sec_scaleup_app_x: gauge, time_sec_scaledown_app_x: gauge, energy_scaleup_app_x: gauge, energy_scaledown_app_x: gauge |
Measures app scaling, capturing the frequency, duration, and energy usage of scale-up and scale-down events. |
Traffic (egress / ingress) total_mb_egress_throughput_svc_x: counter, mean_mb_egress_throughput_svc_x: gauge, mean_energy_egress_throughput_svc_x: gauge, total_mb_ingress_throughput_svc_x: counter, mean_mb_ingress_throughput_svc_x: gauge, mean_energy_ingress_throughput_svc_x: gauge, Maybe a histogram here. To show the "travel distance" based on response time (in the direction of dns dig). |
Tracks data throughput of services and response times for incoming and outgoing network traffic and mapping this to energy consumption. Metrics are based on time windows. |
Rollout total_rollout_app_x: counter (captured by K8s), time_rollout_app_x: gauge, energy_rollout_app_x: gauge |
Focuses on the deployment process, quantifying the number, duration, and energy usage of app rollouts. |
These metrics serve merely as examples to illustrate the concept. Assessing how the system utilizes resources to support other Kubernetes functionalities is also crucial. Ultimately, the complete list of metrics would be more extensive, necessitating the development of a more detailed version alongside a proof of concept (POC). This is an area the CNCF TAG Environmental Sustainability could explore, especially if there's interest from the community in supporting such a project. Some metrics may primarily target Kubernetes maintainers rather than platform engineers, which also requires careful consideration.
Collecting the Metrics
It's important to note that observability comes at a significant cost, which may not always be justified. Continuous monitoring of every metric isn't necessary. These metrics could prove particularly useful during the initial system setup, for periodic reviews over a couple of days each month to track changes in resource usage, or during debugging sessions.
Kepler's detailed approach to metrics collection addresses a key aspect of the data we need for these new metrics. This needs to be taken further to better capture platform engineering aspects. Utilizing eBPF provides a bridge from the cluster level down to the kernel of individual nodes, allowing for the capture of the best raw data possible. Where gaps remain, machine learning models could offer insights, pending the development of appropriate interfaces.
These metrics would enable platform teams to refine platform configurations and collaborate with developer teams to enhance application design. Additionally, some metrics could serve as the basis for automated decision-making regarding scalability and scheduling in Kubernetes. They might also act as key performance indicators (KPIs) for assessing platform maturity.